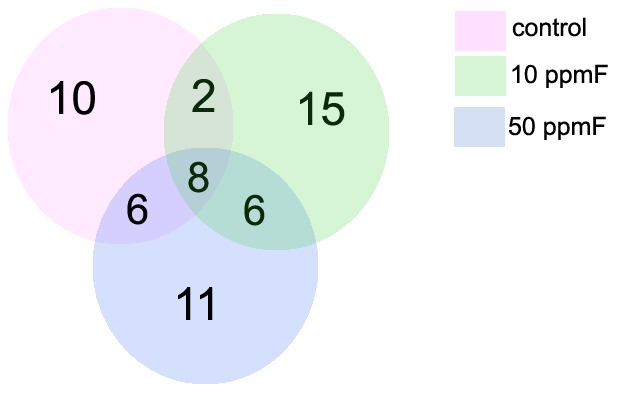
Figure 1. Venn diagram showing distribution of total kidney proteins identified with differences in expression from the 2D-PAGE and LC-MS/MS-based proteome.

The numbers indicate the total protein identified from each comparison (control, 10 and 50 ppmF A/J and 129P3/J) and the number of proteins commonly identified between them.
