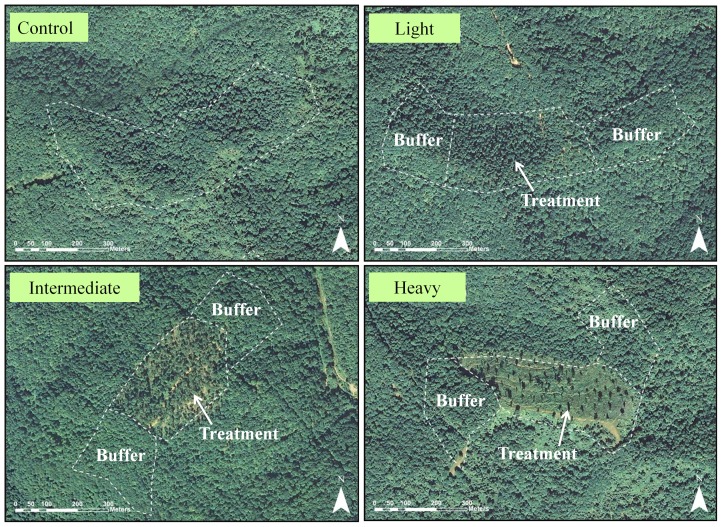
Figure 2. Aerial photos from a study site (LW) depicting treatment plot design and intensity of disturbances.
Each field site consisted of three 10-ha treatment plots of various disturbance intensity (created via partial timber harvest) and one 20-ha control plot (undisturbed). Ten ha of undisturbed forest outside the borders of each treatment plot (buffers) allowed for examination of edge effects of the disturbances.

