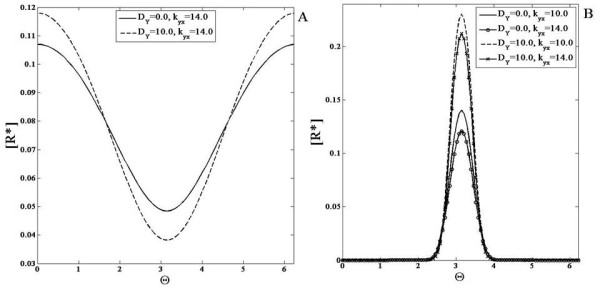
Figure 5.

ComparisonResponse of the negative feedback module. This module is simulated with a (A) gradient signal and a (B) localized signal input. The response of the module when the feedback strength is varied is shown for when the feedback element Y is non-diffusible and highly diffusible. (A) R∗is shown for (non-diffusible case) kyx = 14.0 (solid line) and (diffusible case) kyx = 14.0 (dashed line). (B) R∗is shown for (the non-diffusible case) kyx = 10.0 (solid line) and 14.0 (solid line with circles) and (the diffusible case) kyx = 10.0 (dashed line) and 14.0 (solid line with x markers). The response exhibits a profile qualitatively similar to the signal but the concentration everywhere is reduced due to the negative feedback. As the feedback constant kyx increases, the total concentration of the response decreases everywhere. The spatial profile of R∗in the diffusible case shows stronger spatial variation than the corresponding non-diffusible case.
