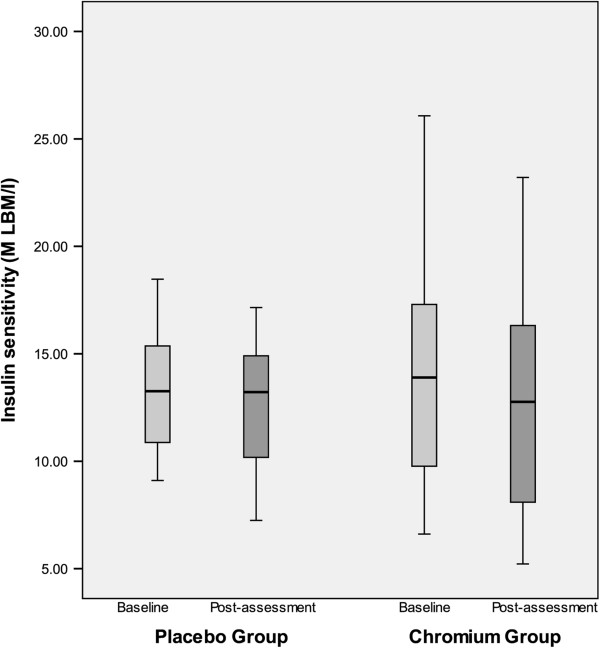
Figure 1.
Boxplot of pre and post insulin sensitivity as measured by euglycemic hyperinsulinemic clamp (M LBM/I) by group (0 = placebo group, 1 =chromium group) after 16 weeks of chromium picolinate versus placebo. There was no significant change in insulin sensitivity. -1.63 mg/min/kg/mU insulin (-8.9 to + 5.57) in the placebo group and -1.14 mg/min/kg/mU insulin (-5.22 to + 4.11) in the chromium group (p=0.83). The serum chromium levels ranged from less than 0.5 to 1.0 μg/L in the placebo group and 0.8 to 5.5 μg/L (mean 3.0) in the chromium treated group.

