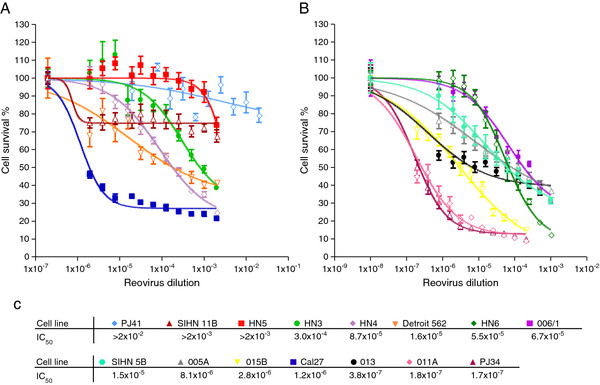
Figure 1.
HN cell lines have a wide range of reovirus IC50 dilution values. A, B. HN cells were infected with reovirus at 1.4×10⁹ TCID50/ml diluted 2 fold, starting from a 1:500, a 1:1000 or a 1:5000 dilution. Cell survival was assessed by MTT assay at 96 hours post-infection. Data were log transformed and plotted as sigmoidal dose response curves, with uninfected controls assigned an arbitrary value of 1×10⁻⁸. Means are from 3 independent experiments and error bars represent SEMs. C. IC50 dilutions of reovirus were interpolated from the dose response curves.

