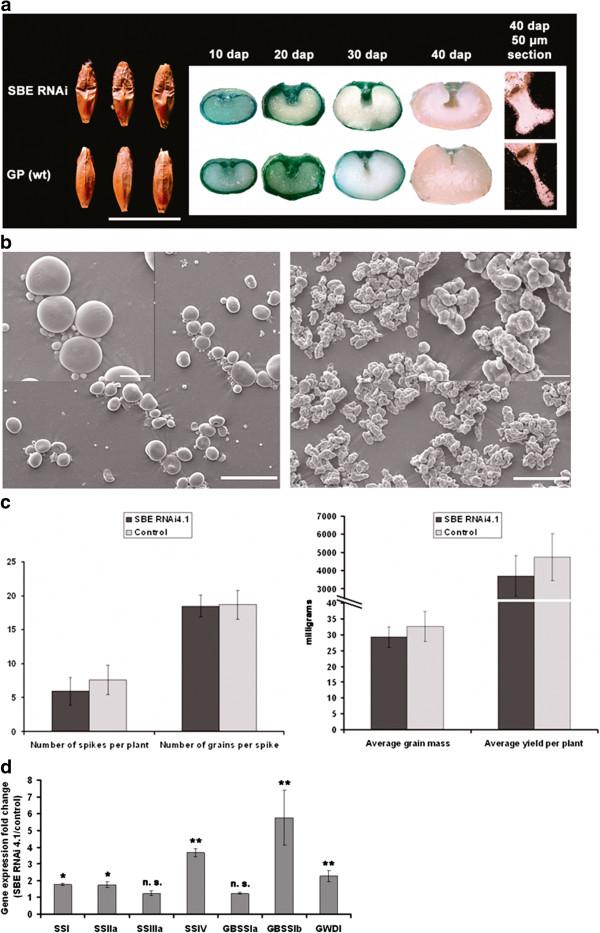
Figure 3.

SBE silencing affected grain shape, starch granule morphology, plants yield and expressions of other starch biosynthetic genes. (a) Morphology, median cross sections and thin sections (50 μm) of representative SBE RNAi and control grains. (b) Scanning electron microscopy (SEM) pictures of control (left) and SBE RNAi4.1 (right) starch granules. Scale bars represent 50 μm and 10 μm in the lower and higher magnifications respectively. (c) Semi-field trial yield calculations, from left to right: average number of spikes per plants, average number of grains per spike, average grain mass and average yield per plant for SBE RNAi4.1 (dark grey) and control lines (light grey). Average yield per plant is expressed as total grain mass in milligram and SD bars are indicated. (d) Quantitative gene expressions level measured by RT qPCR of starch biosynthetic enzymes: starch synthases (SSI, SSIIa, SSIIIa, SSIV, GBSSIa, GBSSIb) and glucan water dikinase 1 (GWDI). Data are expressed in gene expression fold change between control and SBE RNAi4.1 lines (3 biological and 9 technical replicates per gene). SE bars are indicated. Genes with significant up-regulation in the SBE RNAi 4.1 line as compared to the control line are marked with * (P < 0.05) or ** (P < 0.01).
