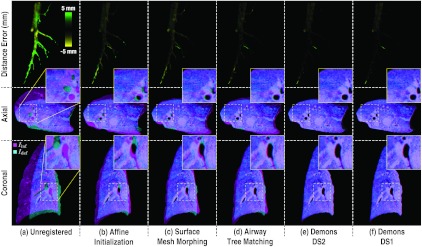
Figure 7.

Registration performance at key steps in the algorithm. The top row shows the signed distance error in airway trees, Ainf and Adef. Axial and coronal slice overlays showing alignment of Iinf (magenta) and Idef (cyan) at each step of the algorithm. The zoomed inset in each case gives qualitative visualization of structure alignment.
