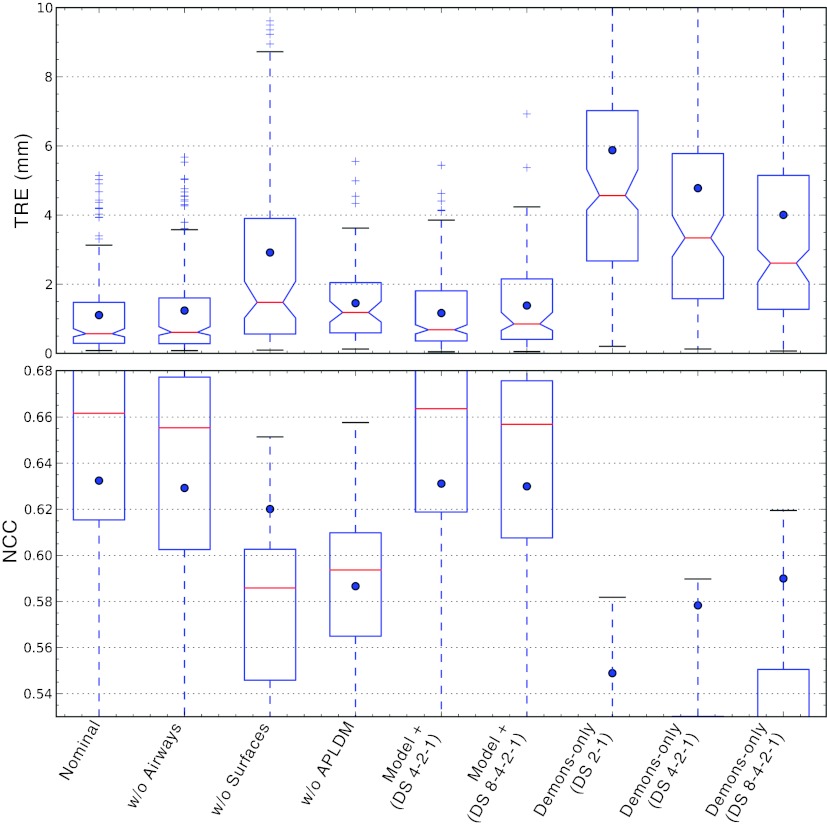
Figure 9.
Variations on the registration process detailed in Sec. 2B. (Top) TRE distributions with dots marking the mean, and (bottom) LNCC distributions computed from a moving window within the lung, with dots marking the global NCC computed over the entire lung.

