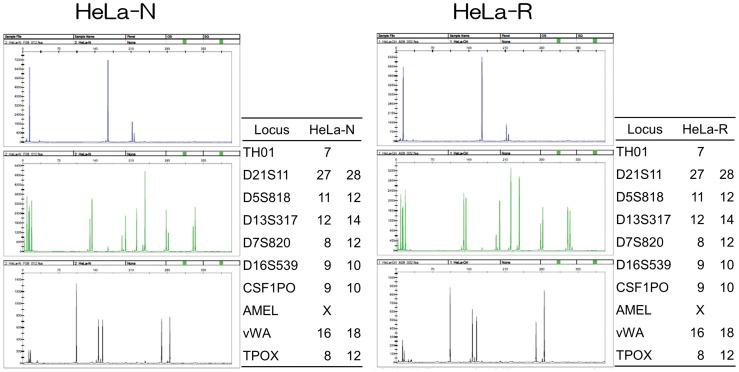
Figure 2. The STR analysis to confirm the identity of HeLa cells.
Left and right panels show the data on HeLa-N and HeLa-R cells, respectively. Graphs were images generated by GeneMapper ver. 3.5 (Applied Biosystems). The allele data were presented as a table on the right side of each image. Locus indicates the name of gene analyzed. It is indicated that the gene presented by one datum was homo and the gene presented by two data was hetero.

