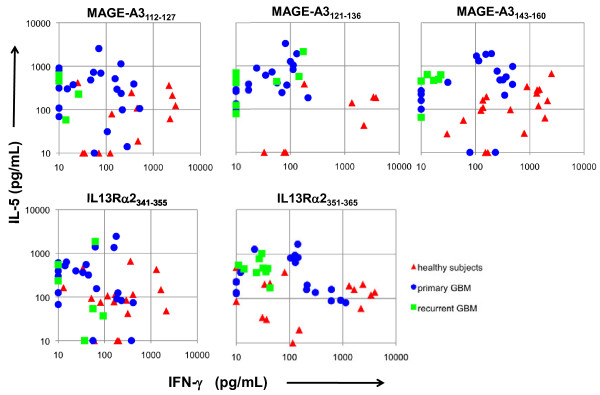
Figure 3.
T cell cytokine profiles to each peptide among each cohort. Each symbol represents the IFN-γ and IL-5 cytokine levels for a positive T cell response, defined as greater than 50 pg/ml and two standard deviations above the mean cytokine levels secreted after stimulation of cells with negative control MBP peptide for each subject. The mean cut-off for a positive cytokine response based on cytokine induced by stimulation with control MBP peptide was 895 pg/ml (range: 13–1298) and 314 pg/ml (range: 72–852) for IFN-γ and IL-5 among healthy subjects, and was 123 pg/ml (range: 0–286) and 312 pg/ml (range: 59–1347) for IFN-γ and IL-5 among GBM patients.

