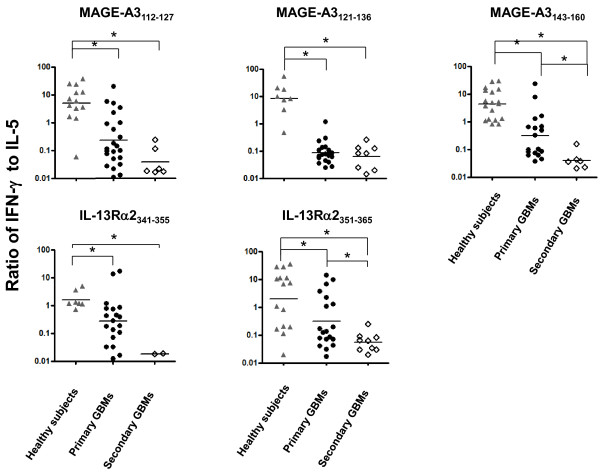
Figure 4.
Th1/2 ratios of T cell responses to each peptide among each cohort. The ratio of IFN-γ to IL-5 for each primary T cell response presented in Figure 3 is presented. Patients with primary GBMs had significantly lower ratios compared to healthy subjects for every antigen examined. Patients with recurrent GBMs had significantly lower ratios compared to patients with primary GBMs in response to the MAGE-A3143-160 and IL-13Rα2351-365 epitopes (p<0.05).

