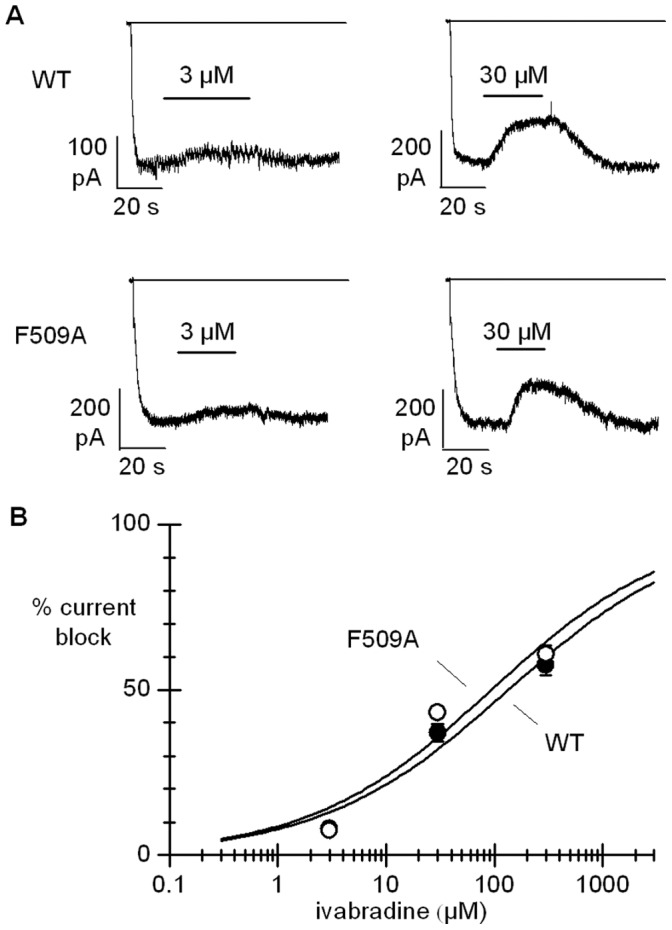
Figure 4. Ivabradine block of WT and F509A channels in the open state.

A, representative traces showing the action of ivabradine (3 and 30 µM) on the current recorded from WT and F509A channels during a long (100 s) step to −100 mV. B, dose-response relations for ivabradine block measured as in A. Hill fitting resulted in IC50, nH values of 120.7 µM, 0.5 and 91.3 µM, 0.5 for WT (filled circles) and F509A channels (open circles), respectively (non-significantly different, P>0.05).
