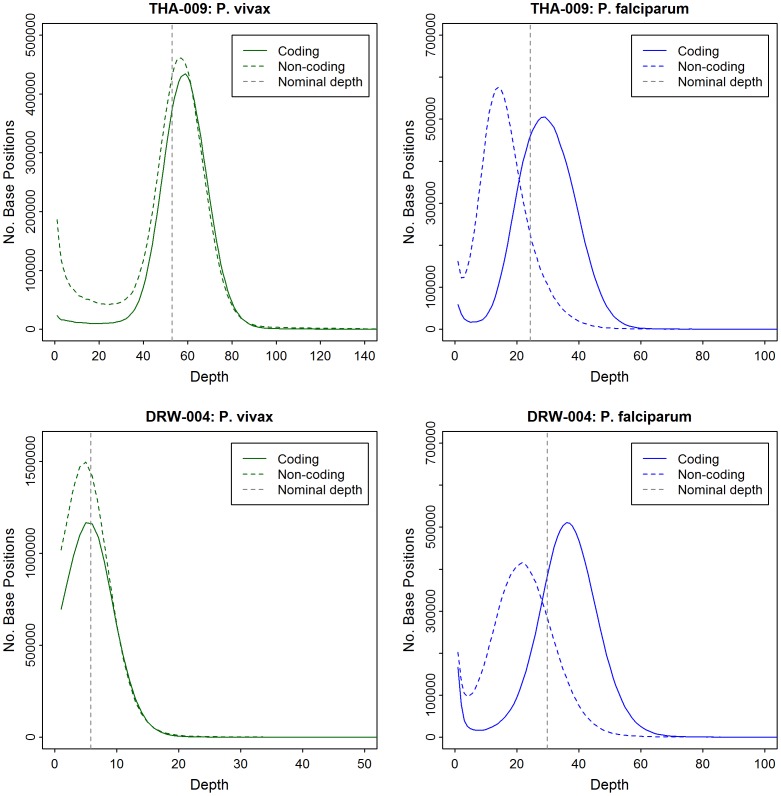
Figure 7. Comparative Sequence Depth Distributions between the P. vivax and P. falciparum Genome in THA-009 and DRW-004.
Plots indicate the number of bases (y-axis) with a given sequence depth (x-axis) in different regions of the P. vivax (green) and P. falciparum (blue) genome. Whilst the P. vivax coding and non-coding sequences peak close to the nominal total sequence depth, the P. falciparum coding and non-coding sequences peak at moderately different coverage depths.

