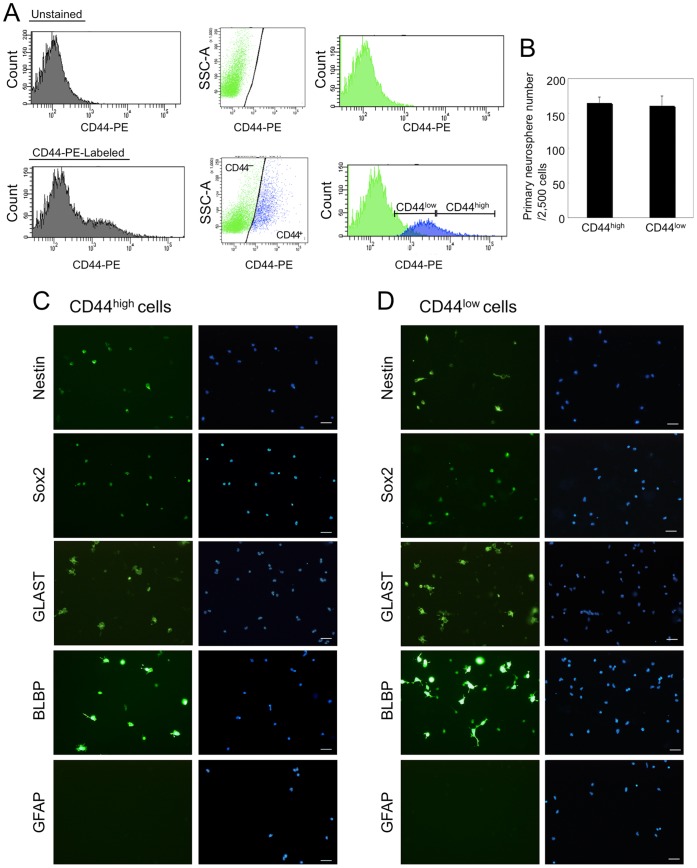
Figure 1. The characterization of CD44high cells and CD44low cells.
A: FACS plots of CD44 positive cells from glial-enriched cellular fraction of P3 mouse cerebellum. There was overlap in the histogram of cell number vs fluorescence intensity of CD44 antibody staining (CD44–PE) between the CD44-positive population and the CD44-negative population (left histograms). To separate CD44-positive cells from CD44-negative cells, side scatter (SSC) vs. CD44-PE (Dot plots) and the gates to separate the CD44-negative population from the CD44-positive population (reflected in the right histograms) were determined. CD44high cells (about 5% of glial-enriched cellular fraction) and CD44low cells were isolated by FACS. B: The number of primary neurospheres. C&D: Immunostaining of nestin, Sox2, GLAST, BLBP and GFAP on CD44high cells (C) and CD44low cells (D) isolated by FACS. Scale bars, 50 µm.

