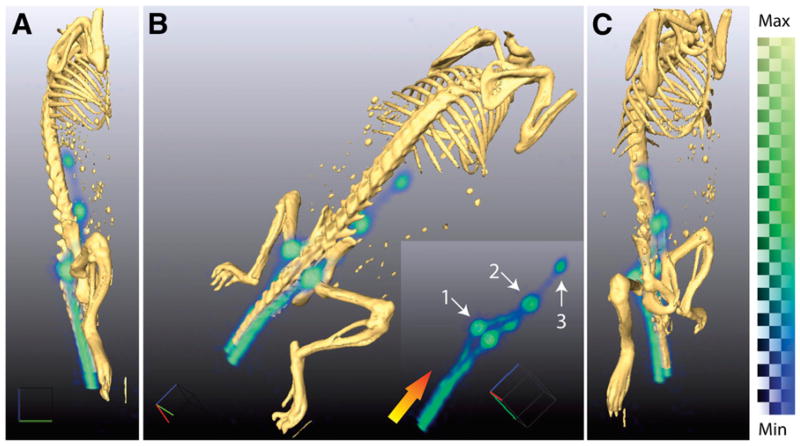
Figure 1.
Three-dimensionally rendered positron lymphography images demonstrate high-resolution mapping using intradermal administration of 18F-FDG to a male nu/nu mouse at multiple angles (A–C). Radiotracer is transported from site of injection through lymphatic system, enabling visualization of lymph flow. Delineation of LN draining injection site is clearly distinguished (B; insert is without fused CT). At 10 min after injection, we can identify lymphatic vessels in tail leading first to sacral nodes (1). Tracer then moves proximally to caudal (2) and then mesenteric nodes (3). Gradient arrow indicates direction of flow. Three-dimensionally rendered PET data are generated from weighted average of intensities from all 2-dimensional slices. As such, it is strictly semiquantitative; color bar indicates range of intensities. Max = maximum; Min = minimum.

