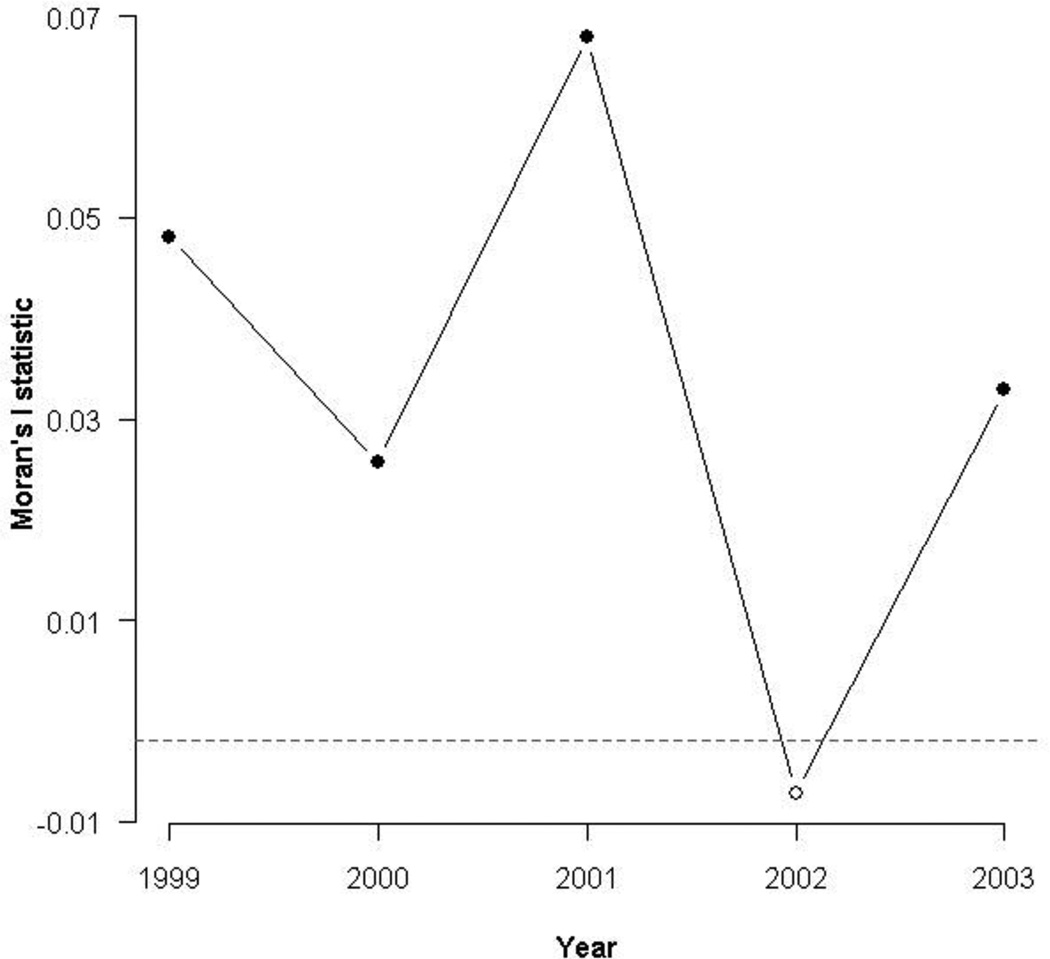
Figure 3.
Moran's I statistics used to determine the significance of spatial clustering of diarrheal cases road networks between 1999–2003. Points highlighted in black indicate significant clustering effects. The horizontal dashed line represents the expected value of the Moran coefficient under the null hypothesis of no autocorrelation in geographic space. Index values that are greater than that expected by random chance (assuming a significance level of 0.05) are represented by filled dots. Childhood diarrheal disease incidence significantly clustered within road networks across four of five years.

