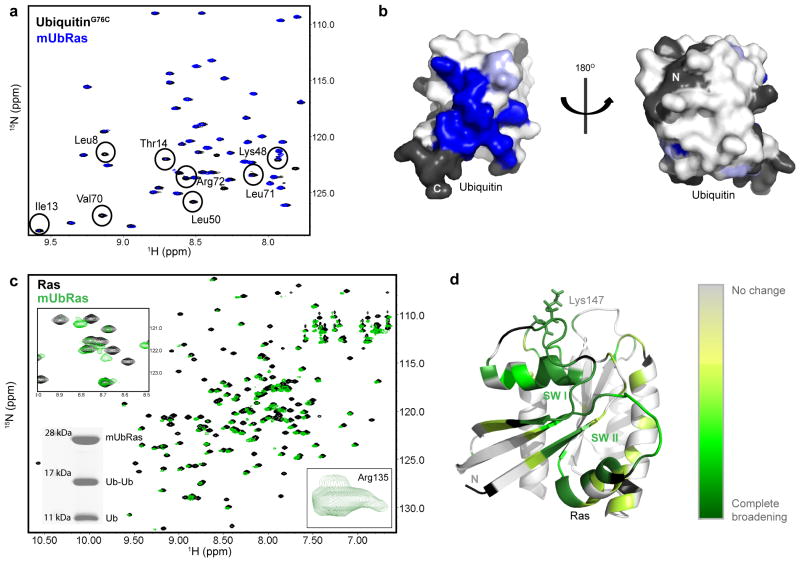
Figure 4.
Surfaces of Ras and Ubiquitin affected by monoubiquitination. (a) HSQC spectra of 15N–UbiquitinG76C free (black) or ligated to RasK147C (blue). Residues that broaden are labeled based on previous assignments40. (b) Space filling model of the structure of Ubiquitin (1UBQ) with residues that show decreased intensity when ligated to Ras (blue). Residues with no information are colored black. (c) HSQC spectra of 15N–RasK147C bound to Mg–GDP alone (black) and when monoubiquitinated (green). Inset (Top): enhancement of one expanded region showing residues that broaden and disappear. Inset (Bottom Left): SDS–PAGE gel showing integrity of mUbRas sample after HSQC analysis. Inset (Bottom Right): close up of Arg135, which exhibits multiple populations. (d) Mapping of Ras backbone amides that disappear upon monoubiquitination onto the structure of Ras. Darker green indicates more appreciable broadening (primarily in the SW I and SW II). Residues with no information are colored black.

