Fig. 1.

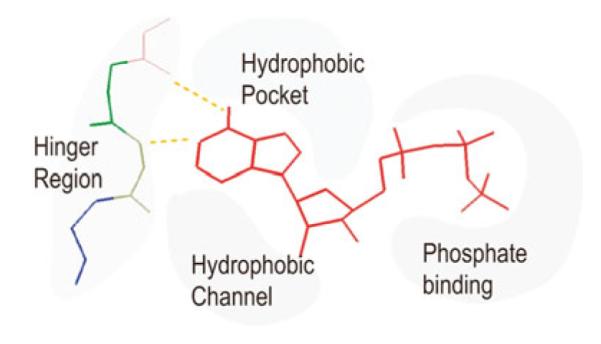
Pharmacophore model of the ATP-binding site of protein kinases. ATP is in red. Also depicted are the hydrophobic pocket, the hydrophobic channel, the hinge region, and the phosphate binding region

Pharmacophore model of the ATP-binding site of protein kinases. ATP is in red. Also depicted are the hydrophobic pocket, the hydrophobic channel, the hinge region, and the phosphate binding region