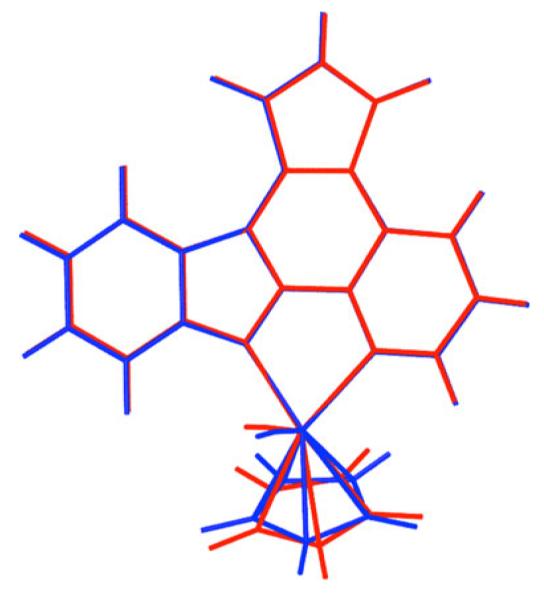
Fig. 5.

Overlay of the minimum energy geometry of the compound 1-R obtained using HF (red) and B3LYP (blue) methods. For both methods, the 6-31 G* basis set was used for the carbon, nitrogen, oxygen and hydrogen atoms, while the LanL2DZ basis set was used for the ruthenium atom. The root mean squared deviation (RMSD) between these two geometries is 0.215 Å
