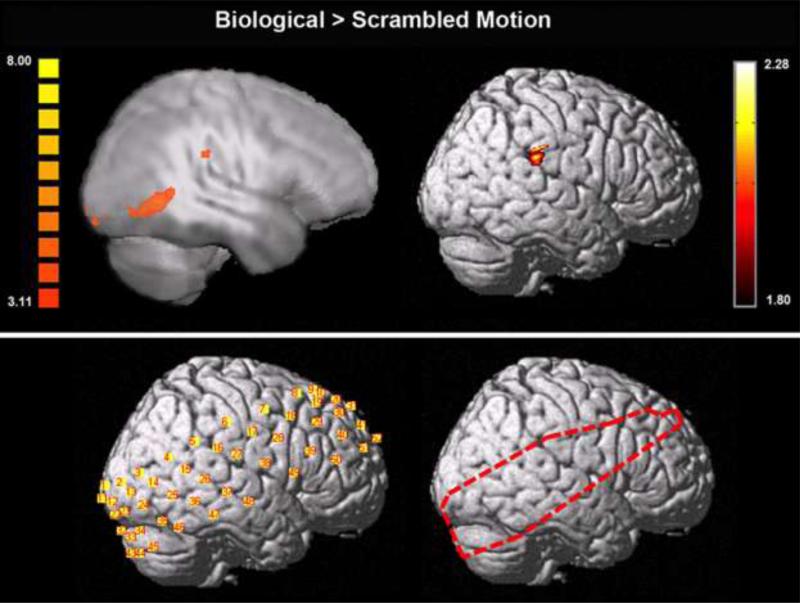
Figure 2.
Activation to biological > scrambled motion measured with functional MRI (top left) and functional NIRS (collapsed across conditions; top right) in an identical group of 12 participants. Functional MRI activation is displayed on a Talairach-transformed template brain depicting functional activation in the plane x = 54 projected onto a smoothed surface map. Functional NIRS activation is displayed on a template brain normalized to MNI space. Functional MRI results were assessed at a corrected threshold of α < .05. Functional NIRS results were assessed at a threshold of p < .05. An example of normalized recording channel placement in MNI space for one participant is shown on the bottom left, while the outline of pixels used in the group analysis (where 11 or more participants had functional data) is shown on the bottom right.

