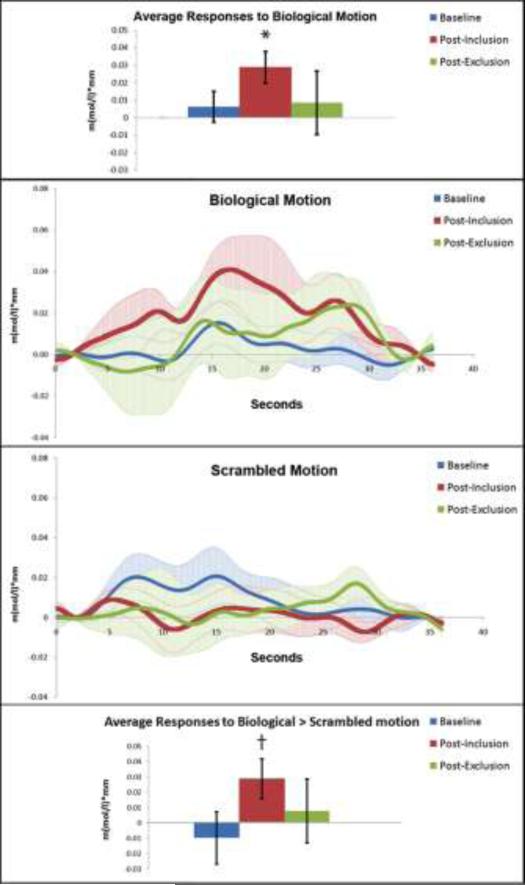
Figure 4.
Activation in participant-specific structurally defined regions of superior temporal sulcus measured with functional NIRS. Average responses to biological motion in each condition 6-16 seconds post-stimulus onset are depicted in the top bar graph. Waveforms depict brain responses to biological motion (middle panel, top) and scrambled motion (middle panel, bottom) in each condition. Average responses to biological > scrambled motion (calculated for each participant, then averaged across the group) in each condition 6-16 seconds post-stimulus onset are depicted in the bottom bar graph. All bars depict standard error, stimulus onset and offset are at 3 and 27 seconds, respectively. * denotes significance at p < .01, while † denotes significance of p = .05.

