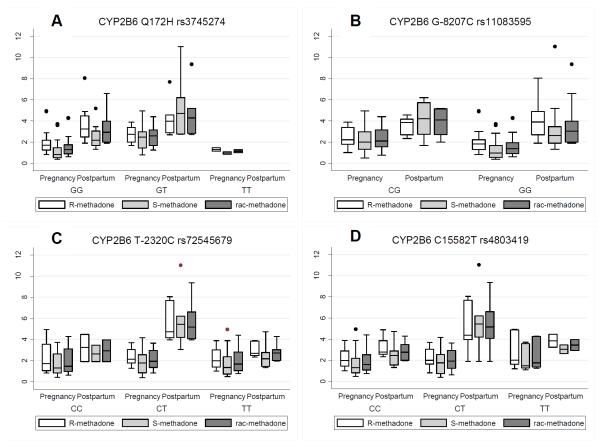
Figure 3.
Variation in L/ D ratios of R-, S- and rac-methadone across pregnancy and postpartum related to CYP2B6 SNPs Boxes represent interquartile range (IQR) of observed values. The median value is represented with a contrasting line within the box. The vertical lines above and below the box (whiskers) are values that are 1.5 times the median but beyond the IQR. Markers (dots) outside the whiskers represent any values outside of these values. (Tukey, J.W. 1977 Exploratory Data Analysis. Reading MA: Addison-Wesley)

