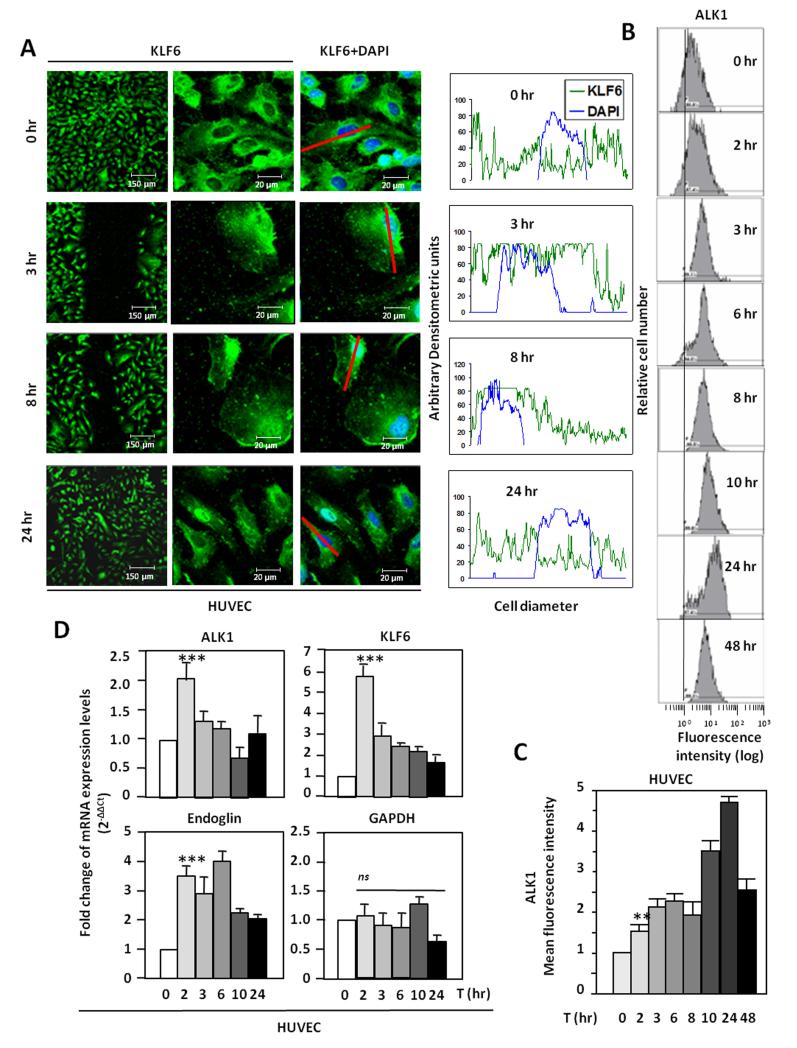
Figure 2. ALK1 expression is upregulated in vitro in endothelial cells after injury.
A. Left, HUVECs were wounded in vitro and the intracellular location of KLF6 was tracked by immunofluorescence. Right, measurements of KLF6 (green) and DAPI nuclear staining (blue) along a longitudinal section of a representative cell (red line) of each condition. Fluorescence intensities were measured and represented in histograms using Image J™ software tool. Cellular distributions of both signals at distinct time points (0, 3, 8 and 24 hr) are shown. B and C. ALK1 protein levels in the surface of HUVECs from A were analyzed by flow cytometry. The time-dependent increase of the ALK1 mean fluorescence intensity is shown in C. D. Real time RT-PCR analysis of ALK1, KLF6, endoglin and GAPDH mRNA levels in HUVECs at different time points after the in vitro denudation.

