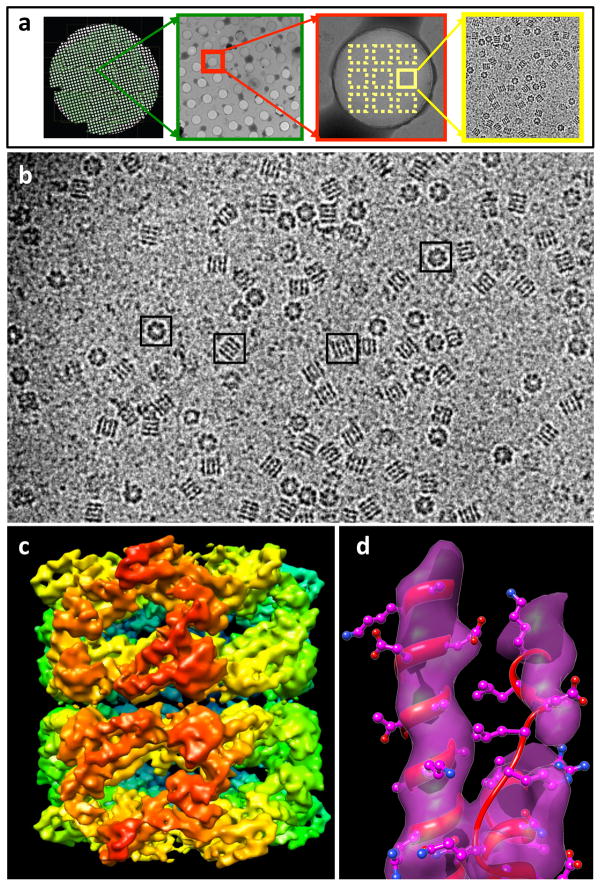
Figure 6.
Automation of macromolecular assembly structure determination by cryo-EM single-particle analysis. (a) Images of a cryo-EM grid at sequentially higher magnification, beginning (left) with an image of the entire grid and concluding with an image of individual structures (right). (b) Representative projection image from a frozen-hydrated specimen of purified GroEL protein complexes. Complexes with distinct orientations relative to the electron beam can be discerned as indicated in the boxed examples. (c) 3D reconstruction using ~ 28,000 individual projection images such as those boxed in panel (b) to generate a density map of the complex at ~ 7 Å resolution. The initial 3D reconstruction was derived by sub-volume averaging using ~ 2000 GroEL particles. Refinement of the initial reconstruction was carried out using almost completely automated procedures as implemented in the software package FREALIGN [111] to refine the structure to ~ 7 Å resolution. (d) Demonstration that the resolution achieved is adequate to visualize α-helices, illustrated by the superposition of a density map of a region of the polypeptide with the corresponding region of a GroEL structure determined by X-ray crystallography (PDB ID: 3E76). Figure panels (b–d) adapted from Bartesaghi et al. (manuscript in preparation).

