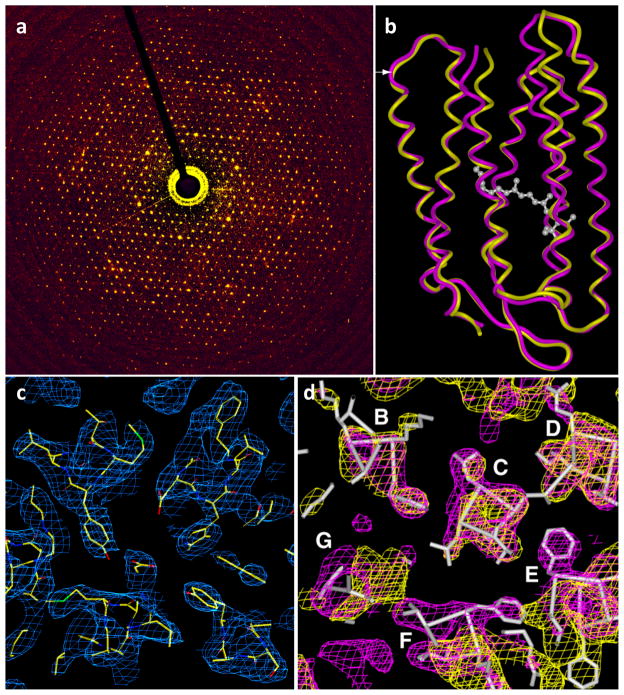
Figure 8.
Determination of membrane protein structure using electron crystallography of 2D crystals. (a) Electron diffraction pattern from bacteriorhodopsin crystals, with reflections extending to ~ 2 Å. (b) Structures of bacteriorhodopsin in native and intermediate conformations at 3.2 Å resolution were obtained by combining phase information present in images of 2D crystals with amplitude information obtained from electron diffraction patterns. (c) σA-weighted density (2FO-FC) map of the open intermediate of bacteriorhodopsin in the center of a lipid bilayer. The map is fitted with the refined atomic model (PDB ID: 1FBK). (d) Sections of bacteriorhodopsin in wild-type (purple) and open intermediate (yellow) conformations, showing the helix movements (from magenta to yellow coordinates) at the cytoplasmic ends of transmembrane helices F and G. The location of the section is marked by the white arrow at the left edge of (b)). The maps are superimposed on the structure of wild-type bacteriorhodopsin, derived by cryo-electron microscopy at 3.2 Å resolution. Figure adapted from [16].

