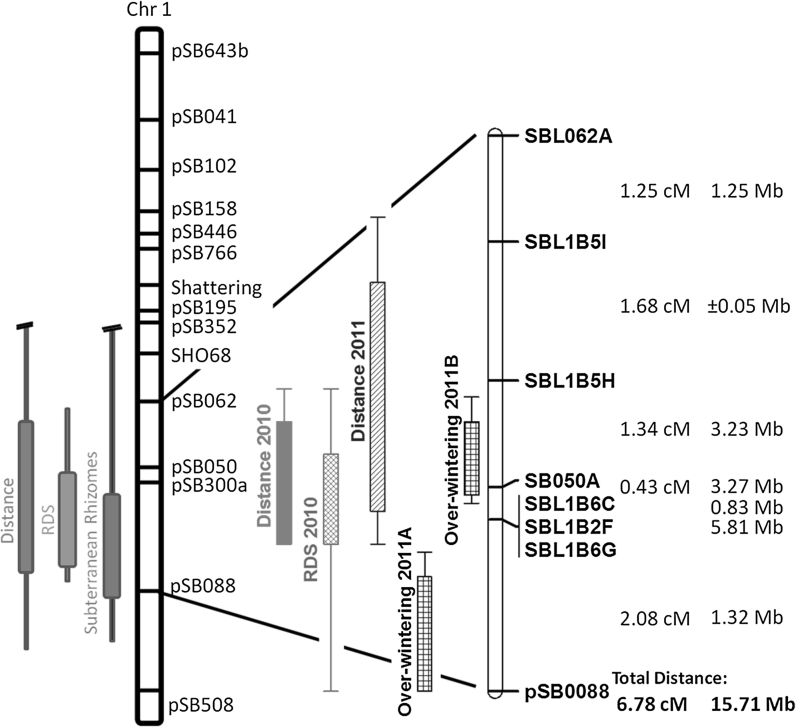
Fig. 1.
Chromosome 1 QTL map. On the left-hand side is the full map of sorghum chromosome one (linkage group C) including QTL as reported by Paterson et al. (1995). The remainder of the figure is an enlargement of a section of chromosome 1 between markers pSB062 and pSB0088 (the chosen region of analysis for this study). Calculated map distances in centimorgans along with actual physical distances from the S. bicolor genome are displayed next to the figure. QTL marked “Over-wintering 2011A” and “Over-wintering 2011B” come from the same data collected in March 2011

