
Figure 7.
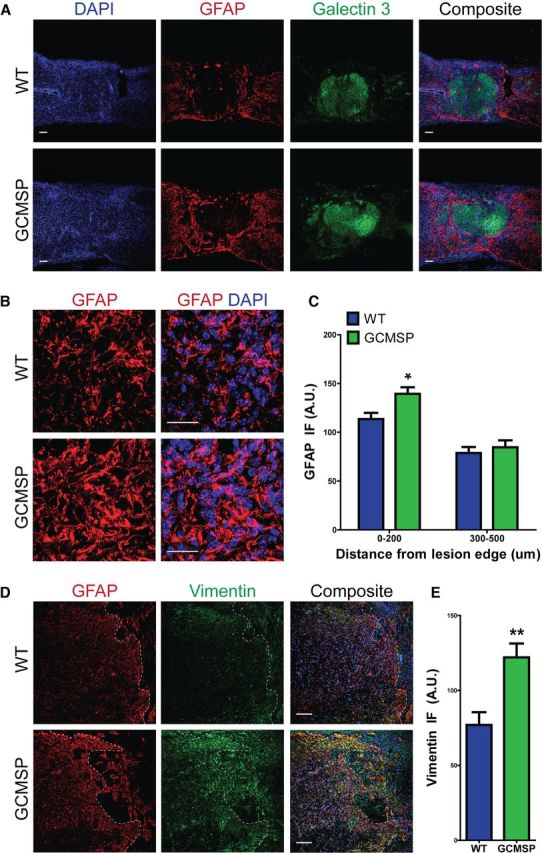
Astrocytic hypertrophy is maintained at chronic stages of injury in GCMSP mice. WT and GCMSP spinal cords were analyzed 35 DPI after injury. A, Astrocytes had more GFAP staining (red) and remained hypertrophic in GCMSP mice, compared with finely processed astrocytes seen in WT cords. Scale bar, 100 μm. B, High magnification shows increased GFAP immunofluorescence (red) and hypertrophy in astrocytes around lesion site in GCMSP cords. Scale bar, 25 μm. C, Quantified GFAP immunofluorescence is increased 0–200 μm from injury edge in GCMSP, but is unchanged 300–500 μm. D, Vimentin immunofluorescence (green) is greatly increased adjacent to lesion in GCMSP, indicating sustained reactive astrocytes. Scale bar, 100 μm. E, Quantified vimentin immunofluorescence is increased in GCMSP injured cords 0–200 μm from lesion edge. n = 3–6 mice, *p < 0.05, **p < 0.01. Dashed white lines indicate lesion edge.