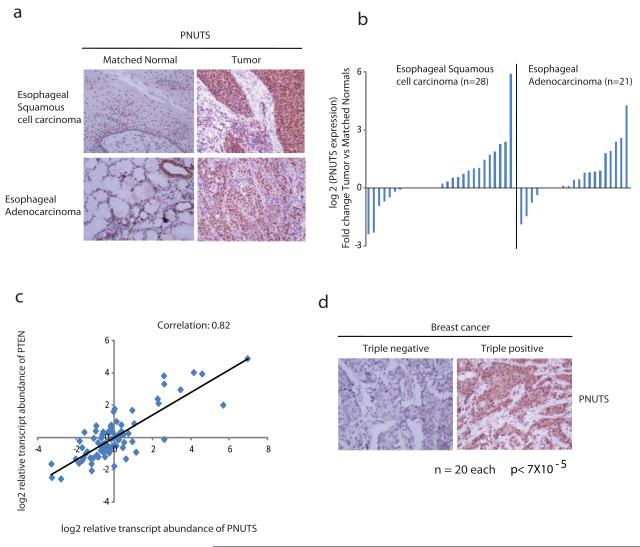
Figure 3. PNUTS is differentially expressed in normal and tumor tissues.
(a) Sections of matched tumor and normal tissues were stained with PNUTS antibody and the representative IHC images were shown. (b) Tissue samples obtained from esophageal squamous cell carcinoma and adenocarcinoma were subjected to immunohistochemistry with specific PNUTS antibody. Data represents the fold change in the overall staining density in tumor sample compared to matched normals. (c) A quantitative RT-PCR analysis was done after extracting RNA from tissues derived from esophageal, pancreatic and colon cancers (n=52) and normal tissues (n=32). Data represents the relative transcript abundance of PNUTS and PTEN normalized against GAPDH. The Pearson’s correlation coefficient is also shown. The trend line depicts the distribution of the data points with respect to perfect correlation (r=1). (d) Tissue samples obtained from triple positive (Er+, PR+, Her2/neu+) and triple negative (Er−, PR−, Her2/neu−) breast cancers (n=20 samples each) were subjected to immunohistochemistry with specific PNUTS antibody. Fisher exact test (two tailed) p value is also shown.

