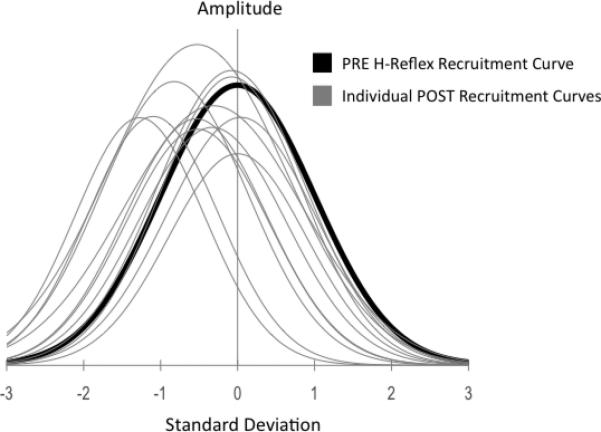
Fig 4a.

Pre-intervention H-reflex Recruitment Curve group data fit to a Gaussian curve, with overlaid group mean H-reflex recruitment curve data post intervention normalized to pre, illustrating the range of responses across subjects and the dominance of a left-hand shift, consistent across the group. A shift of the curve post intervention corresponds to decreased threshold, and larger evoked response relative to stimulus intensity.
