
Fig 4b.
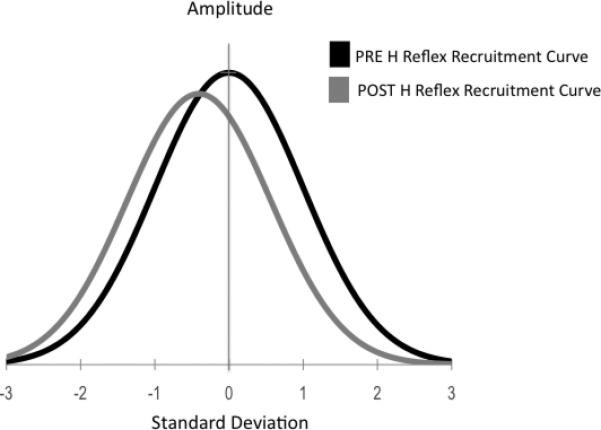
Group H-reflex recruitment curve data post-intervention normalized to pre-intervention, showing the shift to the left of the recruitment curve following the intervention.
Official websites use .gov
A
.gov website belongs to an official
government organization in the United States.
Secure .gov websites use HTTPS
A lock (
) or https:// means you've safely
connected to the .gov website. Share sensitive
information only on official, secure websites.
Group H-reflex recruitment curve data post-intervention normalized to pre-intervention, showing the shift to the left of the recruitment curve following the intervention.