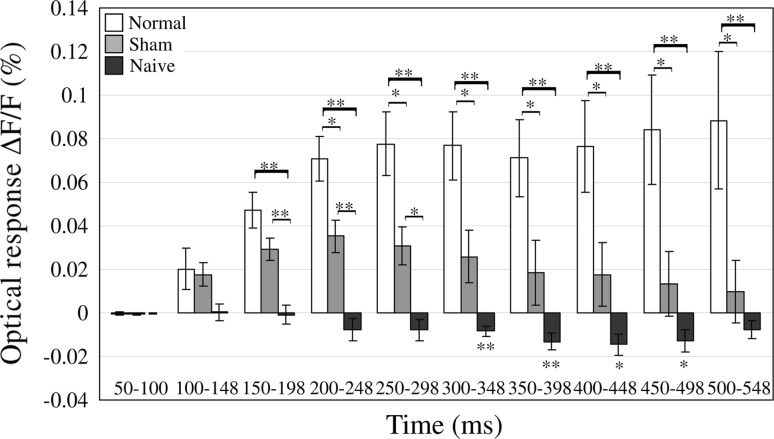
Fig. 5.
Comparison of the mean optical responses to foot-shock alone in the three groups of the normal and sham conditioning and naïve in each bin. Bin width was set at 48 ms. The magnitude of each bar shows the mean optical responses in each bin. Error bar is SEM. Normal: n = 6, Sham: n = 6, Naïve: n = 7, *p < 0.05, **p < 0.01

