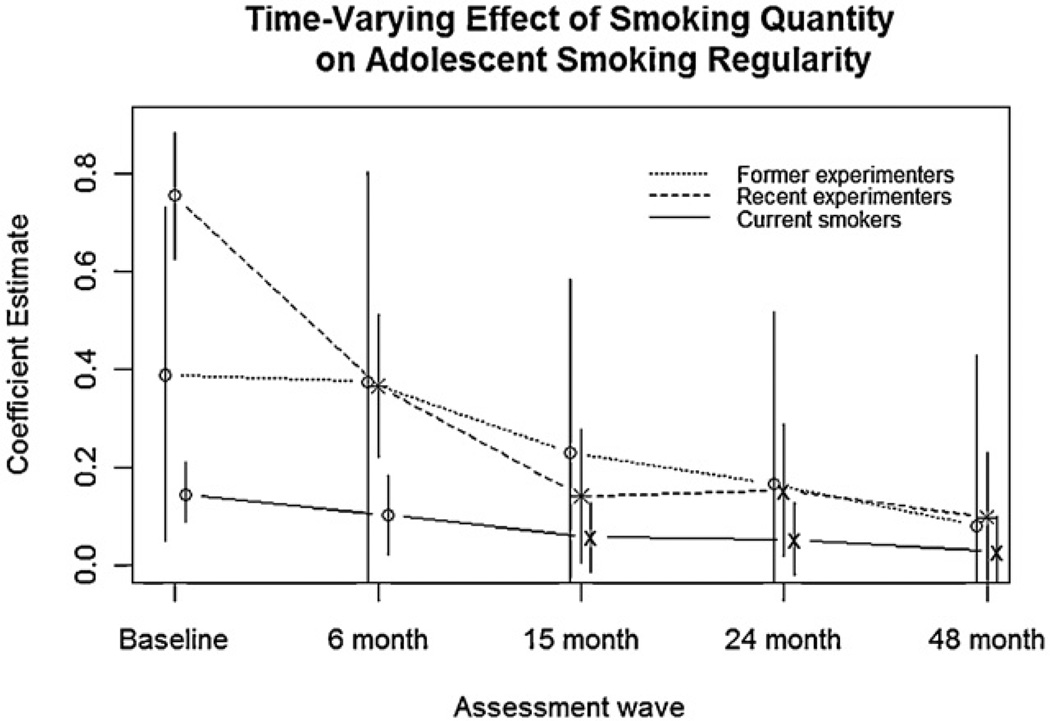
Fig. 1.
Coefficient estimates of smoking quantity from a mixed-effects regression model are shown for each assessment wave, and for each of the three subgroups of adolescent smokers defined at screening: former experimenters (smoked under 100 cigarettes/lifetime but did not smoke in the past 90 days), recent experimenters (smoked under 100 cigarettes/lifetime and smoked in the past 90 days), and current smokers (smoked over 100 cigarettes/lifetime, smoked in the past 30 days, but did not smoke more than 5 cigarettes/day). Smoking groups are slightly staggered around assessment wave to show differences. Coefficient estimates are based on the average fixed effect of smoking quantity across adolescents in each group. Asterisks indicate a significant difference for the corresponding wave, relative to the coefficient estimate of the previous wave, and ’×s indicate a significant difference relative to the baseline wave. Vertical bars indicate 95% confidence intervals.

