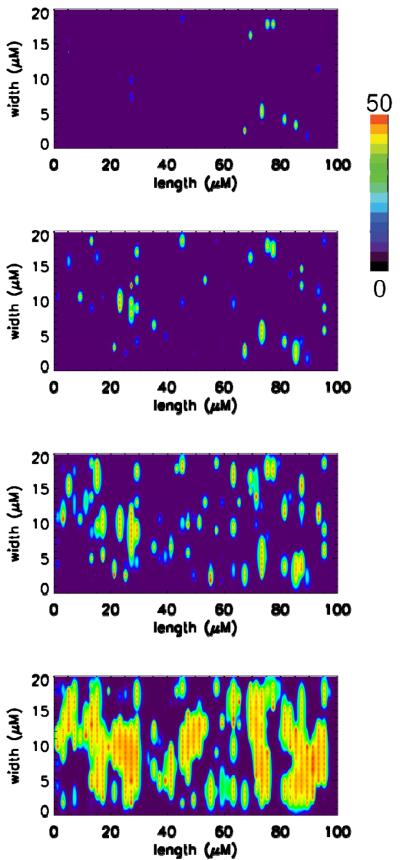
Fig. 4.
A. Spontaneous calcium release during calcium overload conditions (0.15 μM myoplasmic calcium and 1.5 mM network SR calcium). Shown are the concentration of calcium bound to Fluo-3 (Total Fluo-3 – 50 μM) for one focal plane of the simulated myocyte separated by 0.4 μm. The rows indicate different time of the simulation separated by 75 ms with time progressing from top to bottom.

