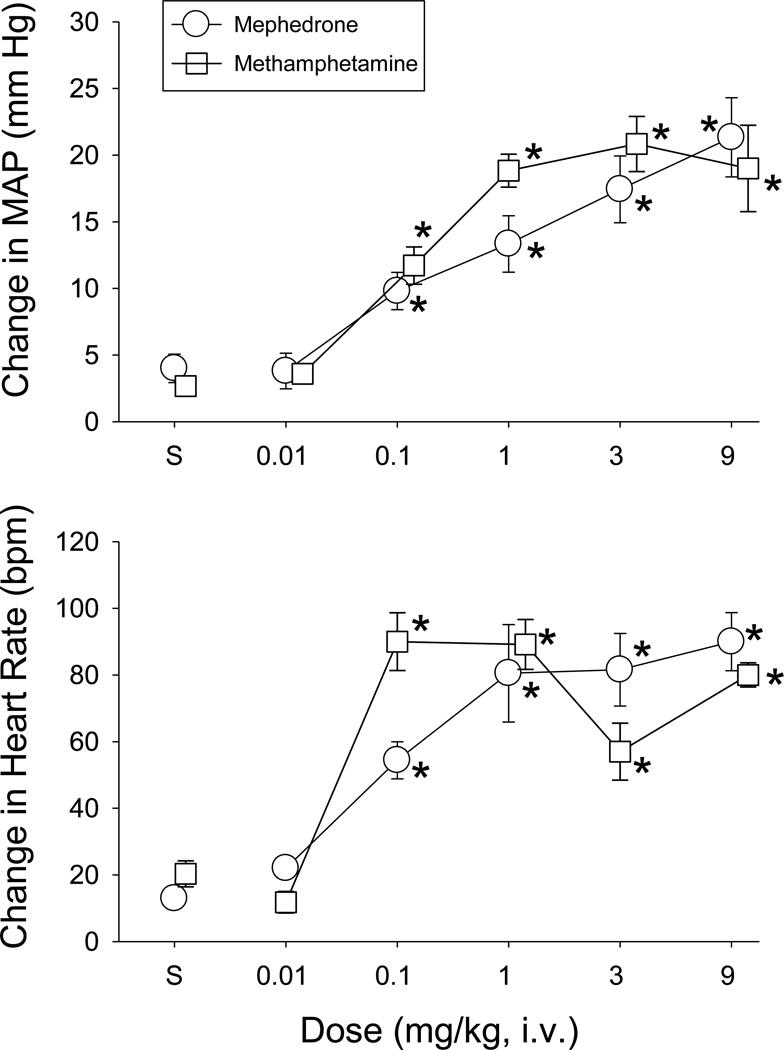
Fig. 6.
MAP and HR responses elicited in conscious rats by the intravenous injection of mephedrone (open circles, n=5–7) or methamphetamine (open squares, n=7). The data points and vertical lines above “S” (i.e., saline control) and in the dose-effect curves represent the mean of the peak changes in MAP and HR and standard error of the mean (SEM). Doses of mephedrone and methamphetamine were delivered once per day in mixed order, except for the 9-mg/kg dose, which was given on the final day. Asterisks indicate doses of mephedrone or methamphetamine that were significantly different from saline administration (p<0.05) as determined by a one-way ANOVA.

