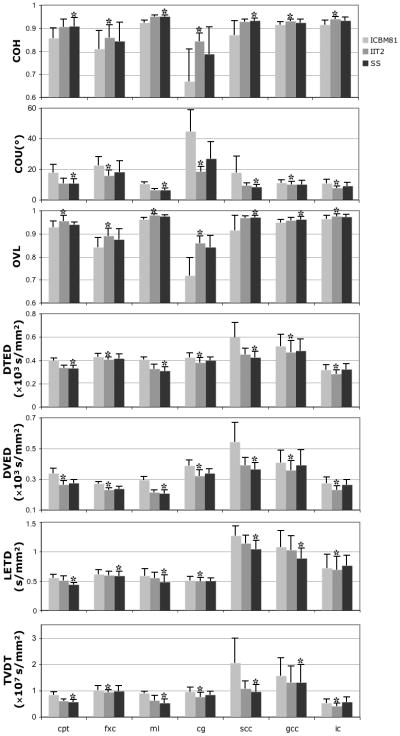
Figure 8.
Means and standard deviations of the COH, COU, average OVL, average DTED, DVED and LETD, and TVDT in selected ROIs, for normalization of Group 2 data to the ICBM81, IIT2, and study-specific templates. For each ROI, the template with the best performance in each metric of spatial normalization accuracy is marked with an asterisk (*).

