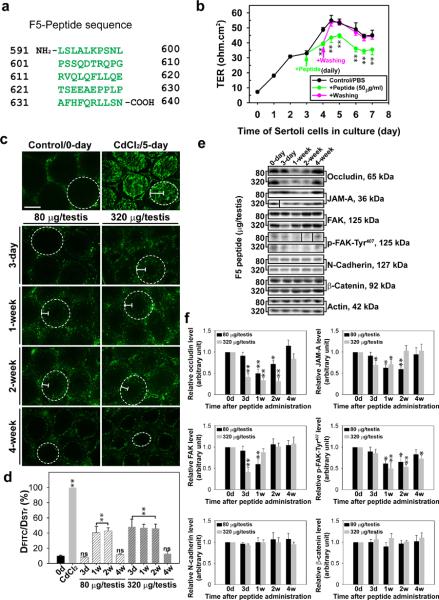
Figure 4. Laminin F5-peptide reversibly perturbs BTB function in vitro and in vivo.
(a) Amino acid residues (green) of the synthetic F5-peptide based on laminin-γ3 DIV. Numerals in “black” denote the sequence of laminin-γ3 chain (see Fig. 1a–c). (b) Effects of the synthetic F5-peptide on the Sertoli cell TJ-permeability barrier. Peptide at 50 μg/ml (~10 μM) was added on day 3 (“green” arrow), which was either included in the daily replacement medium (“green”) (n = 3) or removed by washing on day 4 (“pink” arrow) in medium without peptide (“pink”) versus PBS control. When F5-peptide was removed, the disrupted TJ-barrier was “resealed”, illustrating the disruptive effect was reversible. Each data point is a mean±SD of n = 3 of a representative experiment, and this experiment was repeated 3 times which yielded similar results. **, P < 0.01. (c) BTB integrity assay was performed to assess the ability of an intact BTB to block the movement of FITC-inulin across the BTB from the basal compartment near the basement membrane (annotated by “white” dotted line) to the adluminal compartment. Results of the BTB integrity assay are shown in normal testes (control) versus rats treated with CdCl2 and different peptide treatment groups: 80 μg per testis (or ~10 μM) and 320 μg per testis (~40 μM). Scale bar = 150 μm in c, which also applies to all remaining micrographs. (d) Histograms summarizing data based on findings shown in c by comparing the distance of FITC-inulin diffused into the epithelium (DFITC) (annotated by the “white bracket”) vs. the radius of a seminiferous tubule (DSTr) (average of the longest and shortest axes for sections of oval-shaped tubules) (n = 200 tubules from testes of 3 rats in each group). **, P < 0.01; ns, not significantly different. (e) Immunoblot analysis of different target proteins at the BTB in adult rat testes at different time points after peptide administration. (f) Histograms summarizing data shown in e with n = 3 rats for each time point. *, P<0.05; **, P<0.01.

