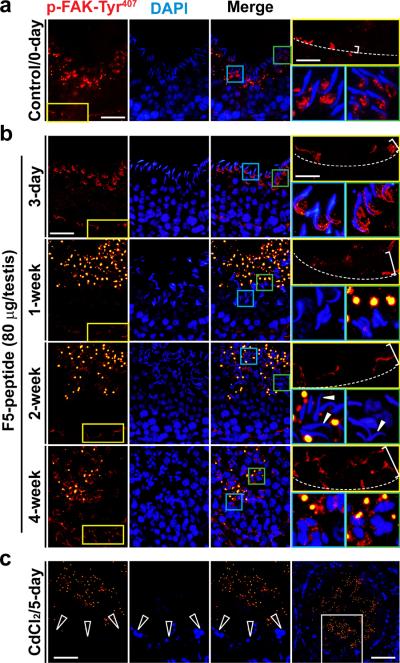
Figure 7. Laminin F5-peptide disrupts BTB and spermatid adhesion via p-FAK-Tyr407.
Testes received vehicle (control) at time 0 (a) versus synthetic F5-peptide at 80 μg/testis (~10 μM), and terminated at 3-day, and 1-, 2- and 4-week (b), and positive control where rats were treated with CdCl2 (5 mg/kg b.w., i.p., for 5 days) (c). In control testes, p-FAK-Tyr407 was localized near the basement membrane consistent with its localization at the BTB [see “yellow” boxed area in the micrograph on the left, which was magnified in the right panel (top) in each row with the relative BTB location annotated by the “broken white-line”]; p-FAK-Tyr407 was also found in the adluminal compartment, restricted almost exclusively to the concave side of the spermatid head at the apical ES [see “blue” and “green” boxed areas in the micrograph on the third column, which were magnified in the right panel (bottom) in each row]. Following F5-peptide treatment, p-FAK-Tyr407 was down-regulated and mis-localized at the BTB, since it no longer restricted to the BTB, but diffused away (see “white” bracket on the top right panel of each column in treatment groups vs. control rats, which was widened over time in treatment groups). p-FAK-Tyr407 was also down-regulated and its localization at the apical ES also shifted from the concave to cover the convex side of the spermatid head by 3-day, and p-FAK-Tyr407 no longer associated with the apical ES in most elongated spermatids by 1- and 2-week, and by 4-week as elongated spermatids were not found in most tubules. In CdCl2-treated rat testes (c), p-FAK-Tyr407 was no longer detectable at the BTB (see “open” white arrowheads), which was the magnified image of the “white” boxed area of the testis in the right column in (c), and p-FAK-Tyr407 was also considerably diminished. p-FAK-Tyr407 appeared as vesicle-like structures near the tubule lumen in rats after treatment (and also in CdCl2-treated rats), representing cytoplasmic droplets from p-FAK-Tyr407-positive materials engulfed by Sertoli cells.23 Scale bar = 50 μm in (a–c), which applies to all micrographs in the first three columns in (a–c), ; scale bar in the “yellow” boxed micrograph = 20 μm, which applies to all “blue” and “green” boxed micrographs in (a, b); scale bar in the last micrograph in (c) = 80 μm.

