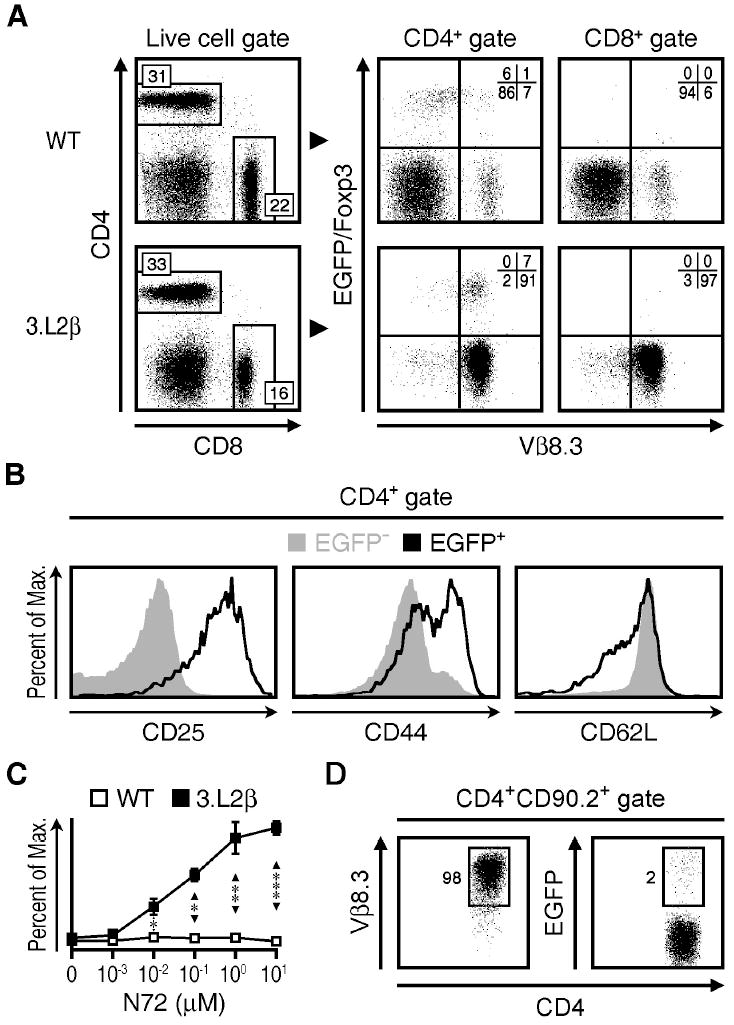
Figure 1. 3.L2β+/- × TCRα+/- mice generate Tconv cells and nTreg cells that are reactive to Hb(64-76) peptide.

A) CD4 versus CD8 staining (left) of live lymphocytes and Foxp3 versus Vβ8.3 expression (right) of gated CD4+ or CD8+ lymphocytes from TCRα+/- mice (WT) or 3.L2β+/- × TCRα+/- mice (3.L2β). B) Histograms of CD25 (left), CD44 (middle) and CD62L (right) staining, for CD4+EGFP− (solid gray) and CD4+EGFP+ (open black) cell populations from 3.L2β mice. C) Proliferation assay showing percent of maximum (2.5 × 10³) counts versus Hb(64-76) peptide (N72) concentration used to activate WT (open) and 3.L2β (closed) splenocytes in culture for 72 hours. D) Vβ8.3 staining (left) and EGFP expression (right) versus CD4 staining of EGFP−CD4+CD90.2+ lymphocytes that were transferred into CD90.1+ mice subsequently immunized with N72 peptide and examined 5 days later. These data are representative of three to five independent experiments, with three to nine mice per group. All quadrant values are means and all error bars represent S.E.M. * p<0.05, ** p<0.005, *** p<0.0005
