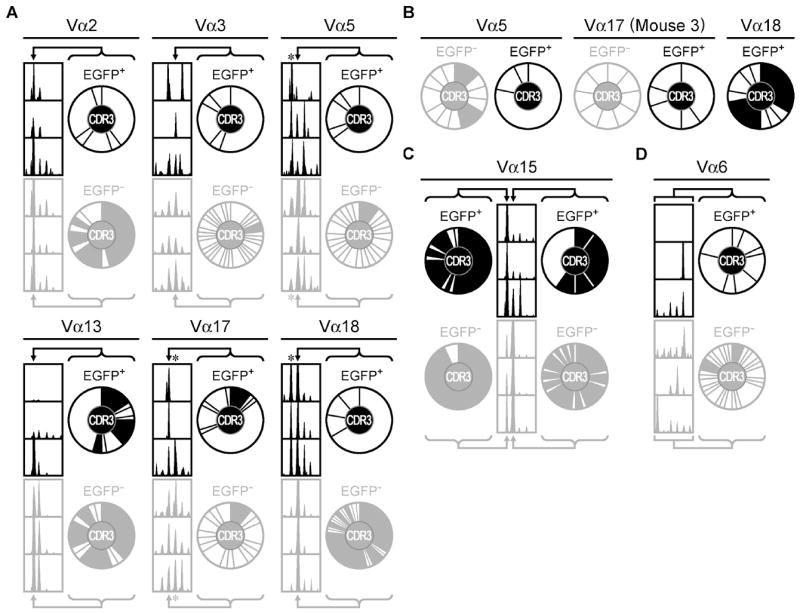
Figure 3. The Vα TCR repertoires of N72-specific nTreg and Tconv cells.

A) Fragment analyses of FAM-labeled PCR products showing the distribution of CDR3 lengths (left). CDR3 pie charts (right) depict the distribution of unique CDR3 amino acid sequences at the indicated CDR3 lengths (arrows), which are equivalent to 12 (Vα2, Vα13), 13 (Vα3, Vα18), or 14 (Vα5, Vα17) amino acids, respectively. The size of the slice is proportional to the clonotype frequency. Shaded slices indicate public amino acid sequences that appear in more than one mouse. B) Pie charts of the unique CDR3 amino acid sequences at the lengths indicated by the asterisks in (A), which are equivalent to 13 (Vα5), 15 (Vα17), or 12 (Vα18) amino acids, respectively. C) Similar analyses as in (A) for clones expressing Vα15, with indicated lengths equivalent to 12-13 amino acids. D) Similar analyses as in (A) for clones expressing Vα6, with indicated lengths equivalent 12-19 amino acids. These data are representative of three independent experiments, with a total of three mice per group. EGFP+ and EGFP− cell populations are represented using black and gray colors, respectively.
