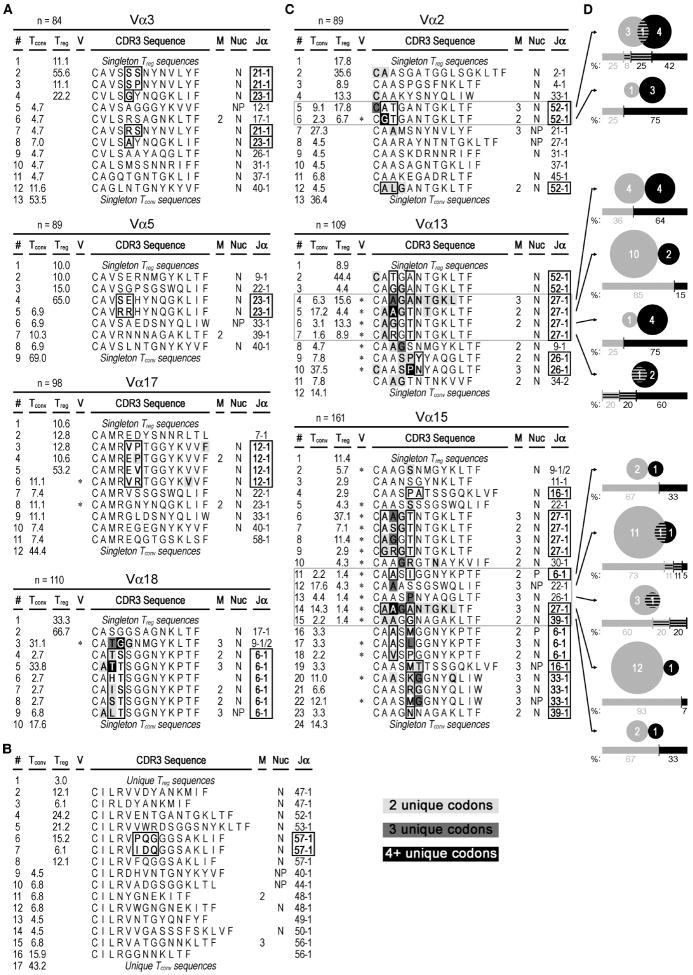
Figure 5. TCRα CDR3 amino acid sequences from N72-specific nTreg and Tconv cell clones.
A-C) CDR3 sequences found two or more times are shown using single-letter amino acid code. Singleton sequences are pooled. The frequency of each CDR3 amino acid sequence is given in the “Treg” and “Tconv” columns. Asterisks in the “V” column indicate use of two or more V-region subfamilies, and the number of mice containing the sequence is listed in the “M” column if the sequence was recovered from more than one mouse. The “Nuc” column indicates the use of N- (N), P- (P), or both N- and P-nucleotides (NP) in one or more samples within each of these respective sequences. Lines with sequences found in both nTreg cell and Tconv cell populations are outlined in gray. At given CDR3 lengths, common Jα usages and the corresponding amino acid positions that show variability in sequence are bolded and outlined in black. Sample sizes are listed in the header of each respective Vα analysis. Conserved amino acids that have more than one underlying codon sequence are also bolded and colored light gray, dark gray or black for 2, 3, or 4+ unique codons, respectively. Line numbers (“#” column, far left) are provided for organizational purposes. A) Analysis of non-overlapping Vα groups based on CDR3 length-selected clones. B) Analysis of the non-overlapping Vα6 group, where the CDR3 regions were not preselected for sequencing based on their length. C) Analysis of CDR3 size-selected Vα groups that show some overlap between the nTreg and Tconv cell populations. D) Venn diagrams show the number of unique clones (n=76) that were found either solely in the Tconv cell (gray) population (n=49), nTreg cell (black) population (n=23), or both (striped, n=4). To be considered clonal, PCR products needed to share the same sequence and come from the same mouse. The respective underlying bar graphs and numbers are similarly colored and represent the percent distribution of samples recovered from the Tconv cell (left) and nTreg cell (right) populations. These data are representative of three independent experiments, with a total of three mice per group.

