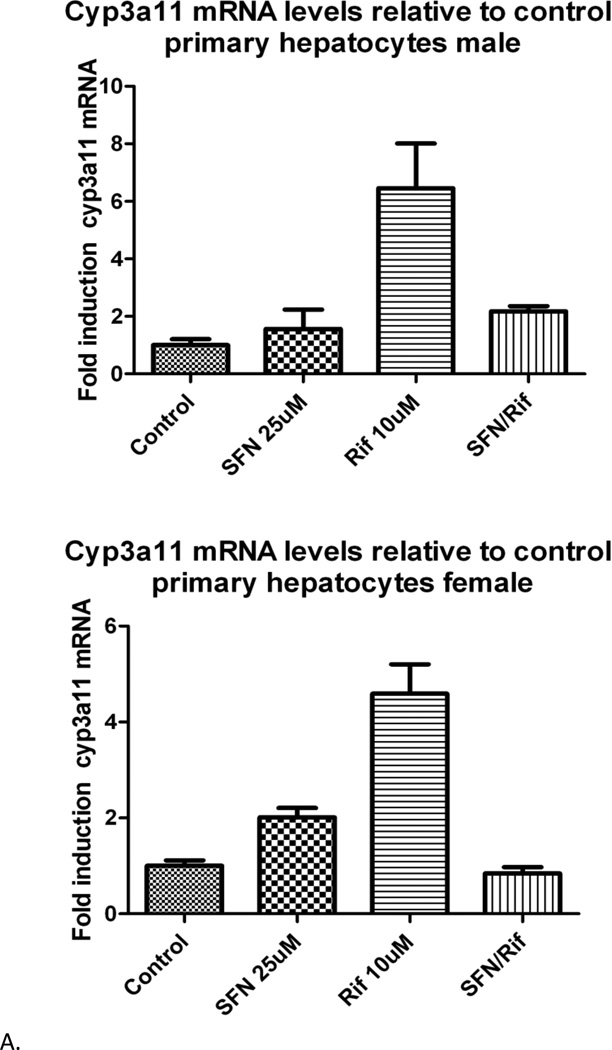
Figure 3.
Hepatocyte cyp3all mRNA levels from representative mice. Top panel. A single male humanized PXR mouse. Bottom panel. A single female humanized PXR mouse. Both sets of hepatocytes show strong induction by RIF and antagonism of that induction by SFN. mRNA levels are reported as fold change relative to control. Error bars represent two separate mRNA measurements.

