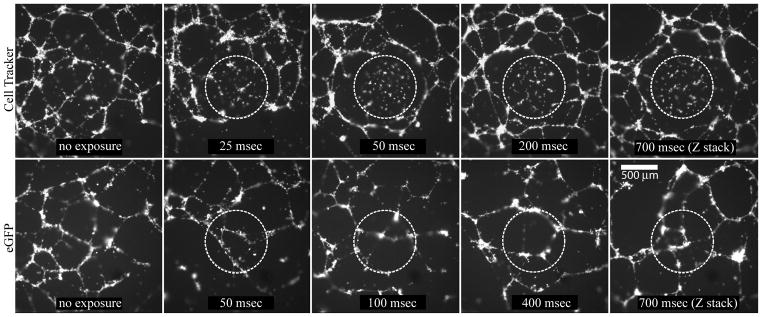
Figure 5.
CellTracker labeled HMECs (top panel) exhibit higher photoxicity compared to the eGFP-expressing HMECs (lower panel). The images represent projections from z-stacks acquired with a 4x objective at the end of a 21 hour, 10-minute interval time lapse experiment set up using a 10x objective and a partially closed diaphragm. The illuminated areas in the center of each well are outlined by dotted lines and the exposure times are indicated. For the right-most images, a 4D acquisition (z-stack over time) was set up, resulting in 700 msec combined exposure of the central areas.

