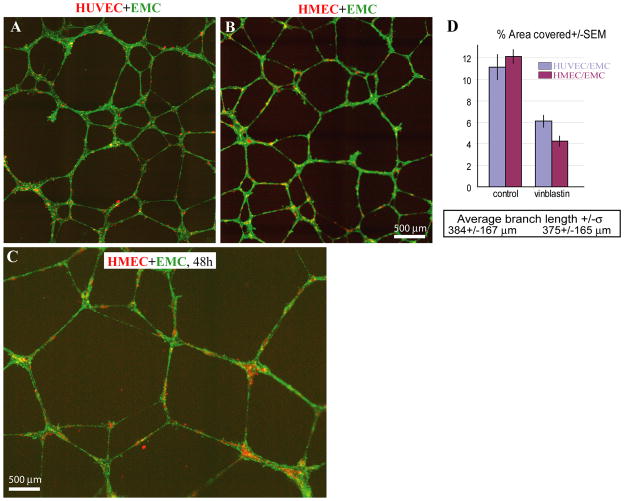
Figure 6.
2D organization of networks formed by HMECs co-cultured with EMCs. (A, B) Representative images of CellTracker-labeled HUVECs and HMECs (pseudocolored red) and EMCs (pseudocolored green) co-cultured on Matrigel for about 20 hours. (C) Representative image of an HMEC/EMC network at 48 hours post-plating. (D) Quantification of the field of view occupied by tube structures as opposed to vacant space (% Area Covered) in control and vinblastin-treated samples. Comparison of images in A and B, as well as morphometric parameters such as average branch length and % area covered, indicate a great degree of similarity between the networks.

