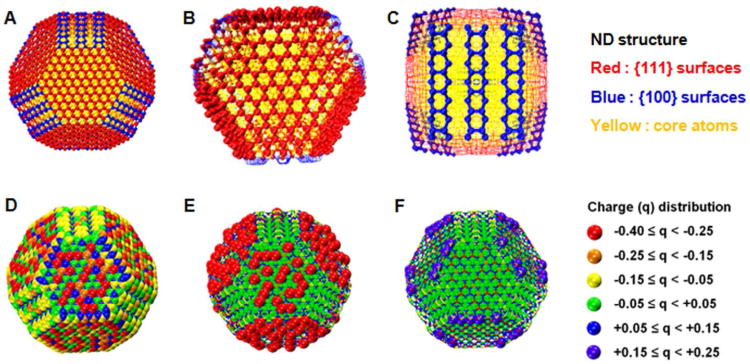
Fig. 1.
The surface charge distribution of a DFTB optimized ND (C5795) structure having a diameter of 4.1 nm. The legend on the right breaks down the intervals of charge that each colored atom represents. (A) the bare optimized ND structure. (B) a close-up view of a graphitized (111) surface. (C) a close-up of the 2×1 surface reconstruction in (100) surface. (D) the complete surface charge (q) distribution. Parts (E) and (F) illustrate the regions containing only the most negatively and most positively charged atoms.

