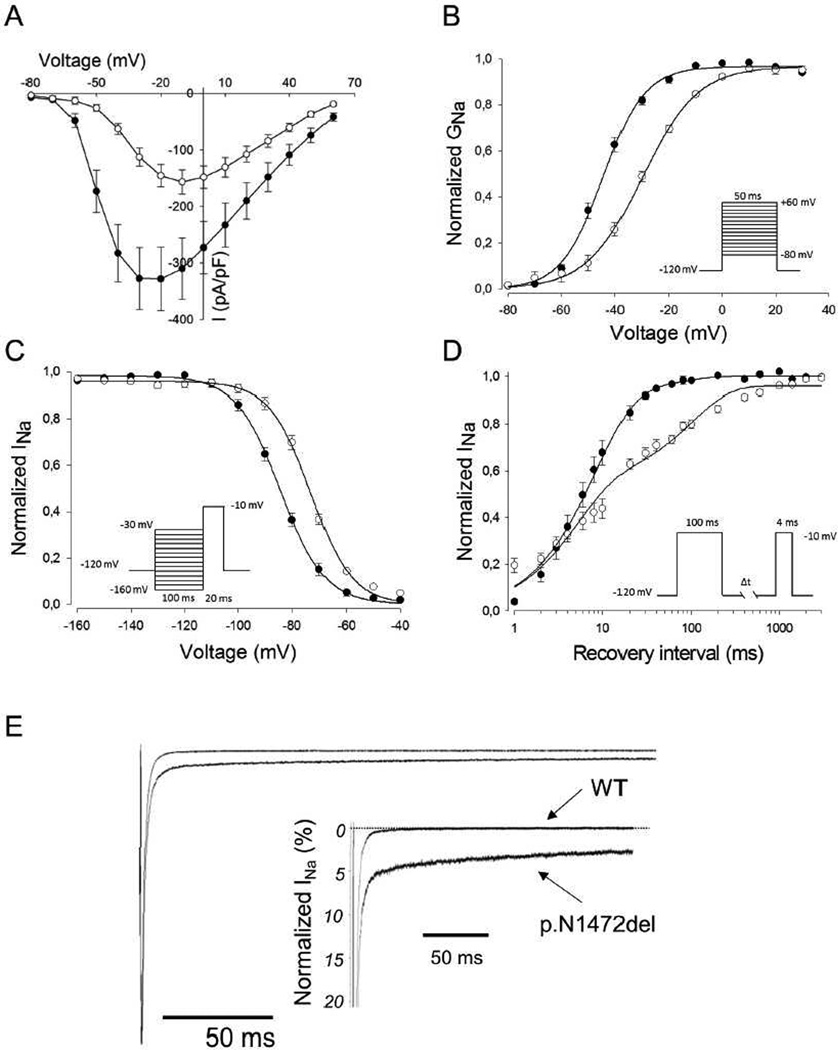
Figure 2. Biophysical properties of WT-NaV1.5 and N1472del sodium channels.
(A) Current-voltage relationships for WT-NaV1.5 (filled circles) and N1472del (open circles). Currents were normalized for cell capacitance to give a measure of sodium current density. (B) Voltage dependence of activation for WT-NaV1.5 (filled circles) and N1472del (open circles) assessed using the voltage protocol illustrated in panel A. Conductance-voltage curves were fit with a Boltzmann distribution (solid lines). (C) The voltage dependence of steady-state inactivation for WT-NaV1.5 (filled circles) and N1472del (open circles). Currents were normalized to the peak current amplitude. Lines represent Boltzmann fits to the data. (D) Recovery from inactivation for WT-NaV1.5 (filled circles) and N1472del (open circles) measured with double-pulse protocol shown in the inset. The current-time curve was fit with a single (WT-NaV1.5) or double-exponential equation (N1472del). (E) Increased TTX-sensitive persistent sodium current for N1472. Persistent sodium current was recorded during a 200 ms depolarizing voltage pulse to −30 mV from a holding potential of −120 mV in the absence then presence of 30 µM TTX followed by offline digital subtraction of the currents. Zero current level is indicated by the dotted line. The inset shows an expanded y-axis scale to emphasize the relative proportion of WT-NaV1.5 and N1472del currents.

