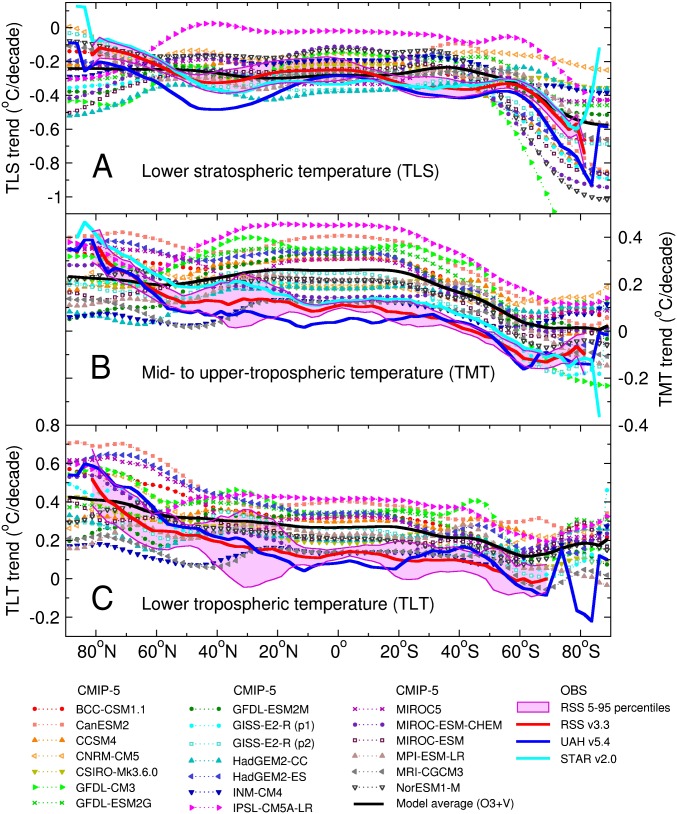
Fig. 3.
Zonal mean trends in observed and synthetic (A) TLS, (B) TMT, and (C) TLT between 1979 and 2011. Observational results are from UAH, STAR, version 3.3 of the RSS dataset, and the 11 RSS percentile realizations. Model synthetic MSU temperatures are from the spliced historical/RCP8.5 runs performed with 20 CMIP-5 models; only the first realization is shown for each model. The CMIP-5 multimodel averages are for the O3+V case. The 5th to 95th percentile range of the RSS results was computed as described in SI Appendix. The close agreement between RSS and UAH global mean TLT trends (SI Appendix, Table S7) masks large differences in the latitudinal structure of each group’s TLT changes. The spatial coverage of the observational datasets differs at high latitudes and over areas of high elevation (SI Appendix). Note that STAR does not produce a TLT dataset.

