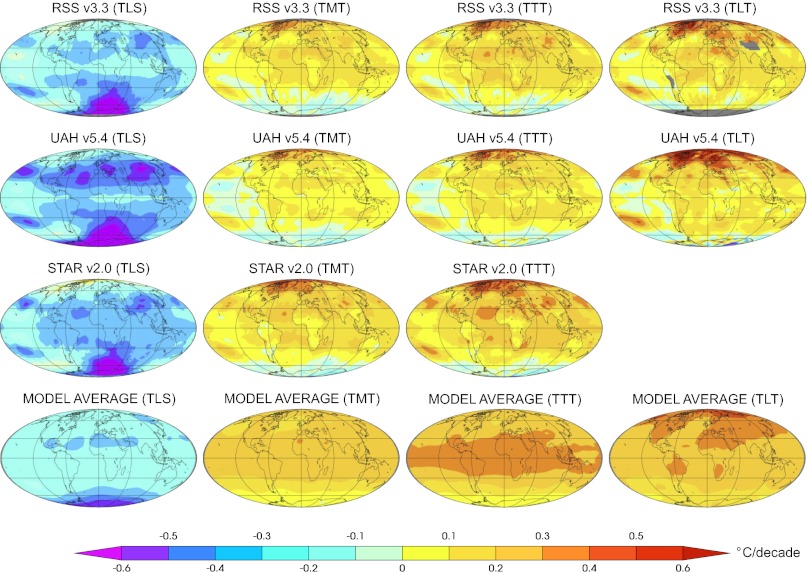
Fig. 4.
Geographical patterns of observed and simulated trends (in degrees Celsius per decade) in TLS, TMT, TTT, and TLT (columns 1–4, respectively). All trends are from 1979 to 2011. Simulated trends are the O3+V multimodel averages of synthetic MSU temperature changes from the spliced historical/RCP8.5 runs. Gray shading denotes areas where temperature information is not provided (SI Appendix).

