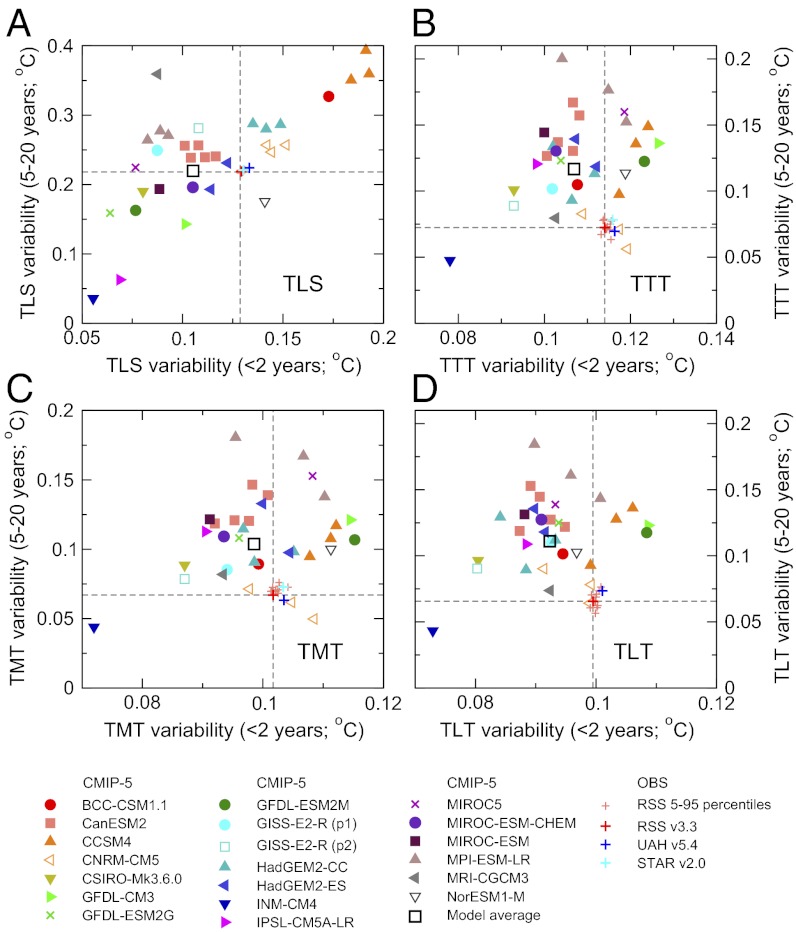
Fig. 5.
Comparison of simulated and observed variability of monthly mean near-global anomalies in (A) TLS, (B) TTT, (C) TMT, and (D) TLT. In each panel, the monthly to interannual timescale variability of detrended, high pass-filtered temperature data ( , x axis) is plotted against the 5- to 20-y timescale variability of band pass-filtered data (
 , y axis). The dashed lines are centered on the observed values of
  and
and  for version 3.3 of the RSS dataset. The multimodel average
  and
and  values were calculated by averaging over the ensemble mean
  and
and  results for each of the 20 individual CMIP-5 models. The same 396 months (January 1979 to December 2011) were used for the analysis of observations and synthetic MSU temperatures from the spliced historical/RCP8.5 runs.

