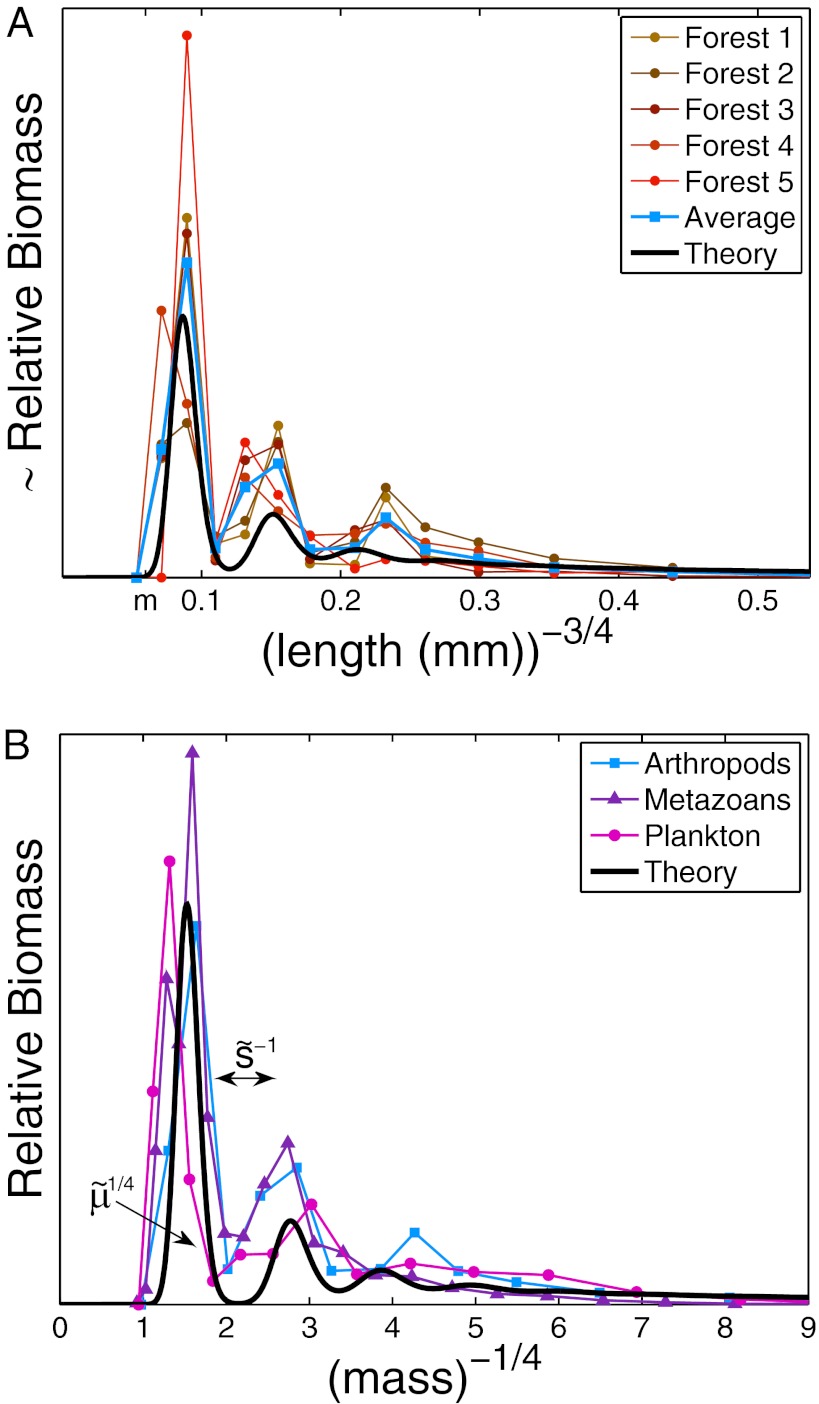
Fig. 3.
Universal body-size distribution. Demonstrated are histograms of biomass as a function of maximal growth rate q, estimated by the well-established empirical relation  (8–12). (A) Arthropods from five different regions [data from Janzen (19), biomass estimated as
  : forest 1-TPR; 2-OS; 3-TPH; 4-SVP; 5-TAP]. To fit the data, we used exchange rate m corresponding to
  , which is about
  (see Methods). (B) Biomass distributions of arthropods (average), phytoplankton [wet weight, 4-y average from Lake Kinneret (22)], and metazoans [dry weight, 1-y average from the Lone Oak stream (23)] are plotted on the same graph. All distributions are lumpy and nearly periodic on the left, followed by a smooth curve on the right, which agrees with our theory (black solid line). To fit all datasets simultaneously, we used
  and
and  , and rescaled the q-axis by the exchange rates m of approximately
  (arthropods),
  (metazoans), and
  (phytoplankton) (see Methods).

