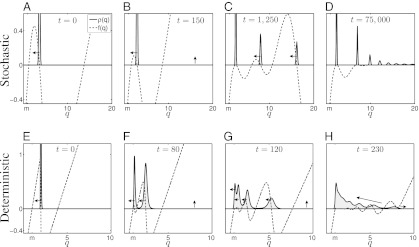
Fig. 4.
Species packing vs. evolutionary suicide. Graphed are time evolutions of the distribution  (solid line) and of the corresponding per capita growth rate,
  (dashed line). (A–D) Stochastic competition (
 ,
,  ). At
). At  , the entire population is packed around
  . Mutants with
  have a substantial competitive advantage (
 ), and they push the pack leftward to lower q (A and B). As the pack moves leftward, the proportion of patches occupied by the
  -pack decreases until their advantage from better competitiveness is sufficiently small and is compensated by the cost of slower colonization (
 has a local maximum at
  ) and the pack stops (C). Meanwhile, new packs with much larger q emerge, and, in turn, also propagate leftward (C). This process ensues until a stationary, multimodal pattern is obtained, in which each pack is located at a local maximum of
  (D). (E–H) Deterministic competition (
 ,
,  ). Evolution pushes the initial packs leftward until they vanish as their q-values approach m (evolutionary suicide). Eventually, newly emerged packs reach the preceding ones, which results in a smooth distribution. See also Movies S1, S2, and S3.

